SoilWaterEquilibrium
Layer-averaged equilibrium volumetric water content (θ_E, Eq. 5.101) and equilibrium matric potential at the layer node (ψ_E, Eq. 5.106) for a single soil layer, following Oleson et al. (2010, CLM4 Tech Note Ch. 5, §5.3.2.1, Eqs. 5.98–5.106). θ_E is fully saturated (θ_sat) when the water table is above the layer (z_v < z_h_upper), otherwise is computed by integrating the hydrostatic-equilibrium Clapp-Hornberger profile across the layer, clamped to [0, θ_sat]. ψ_E is derived from the Brooks-Corey inverse relation with a 1% saturation floor and a hard lower bound at ψ_min = −10⁵ m to prevent numerical underflow. Migrated from UrbanCanopy.jl@9200edd4 src/hydrology.jl:509 (`SoilWaterEquilibrium` @component). Note: the migration-tracker row for this component carried the blocking_gap `other:discretization-plan` because the row description mentioned an in-file Richards-equation PDE at src/hydrology.jl:674. Inspection shows that PDESystem lives in a separate non-`@component` helper function (`RichardsEquation`) and is not part of `SoilWaterEquilibrium`, which is a plain two-equation algebraic `@component`. No discretization plan is needed.
Description
Layer-averaged equilibrium volumetric water content (θ_E, Eq. 5.101) and equilibrium matric potential at the layer node (ψ_E, Eq. 5.106) for a single soil layer, following Oleson et al. (2010, CLM4 Tech Note Ch. 5, §5.3.2.1, Eqs. 5.98–5.106). θ_E is fully saturated (θ_sat) when the water table is above the layer (z_v < z_h_upper), otherwise is computed by integrating the hydrostatic-equilibrium Clapp-Hornberger profile across the layer, clamped to [0, θ_sat]. ψ_E is derived from the Brooks-Corey inverse relation with a 1% saturation floor and a hard lower bound at ψ_min = −10⁵ m to prevent numerical underflow. Migrated from UrbanCanopy.jl@9200edd4 src/hydrology.jl:509 (SoilWaterEquilibrium @component). Note: the migration-tracker row for this component carried the blocking_gap other:discretization-plan because the row description mentioned an in-file Richards-equation PDE at src/hydrology.jl:674. Inspection shows that PDESystem lives in a separate non-@component helper function (RichardsEquation) and is not part of SoilWaterEquilibrium, which is a plain two-equation algebraic @component. No discretization plan is needed.
Reference
_source_ref: UrbanCanopy.jl@9200edd4f15609f20339d3a7d104de8064544310:src/hydrology.jl:509
Upstream SoilWaterEquilibrium is an MTK @component with six @parameters (θ_sat, ψ_sat, B, z_h_upper, z_h_lower, z_v) and two time-indexed @variables (θ_E, ψ_E) given by two algebraic equations with no derivatives. Identical structure preserved here.
The upstream component declares one @constants block: ψ_min = -1.0e5 m (minimum matric potential, converted from the CLM4 value −10⁸ mm). Per the convention of sibling files in this directory (groundwater_drainage.esm, surface_runoff_infiltration.esm), @constants are promoted to parameters with fixed defaults so MTK’s unit checker is satisfied and the equation AST references them by name.
Tracker blocking_gap clarification: the migration-tracker row for this bead read blocking_gap: other:discretization-plan because the row description mentioned internally builds Richards-eq PDE (:674) via MOLFiniteDifference. Inspecting the source shows that RichardsEquation (the PDESystem builder, lines 597–683) is a separate non-@component helper function that is never called by SoilWaterEquilibrium. SoilWaterEquilibrium itself (lines 509–558) is a plain algebraic @component — two equations, no PDESystem, no MOLFiniteDifference. No discretization plan is needed.
Equation 1 (θ_E, Eqs. 5.101–5.102 simplified): The upstream docstring notes that the code uses z_v < z_h_upper as the only branch point (fully-saturated guard), then applies Eq. 5.101 with Eq. 5.105 clamping for all other cases including the water-table-within-layer zone (z_h_upper ≤ z_v ≤ z_h_lower). The Clapp-Hornberger integral term uses the ratio (ψ_sat − z_v + z_h_x)/ψ_sat raised to the exponent (1 − 1/B). When z_v is in the transition zone near z_h_upper, this ratio can become negative (since ψ_sat is small and negative), making the power non-real; the outer max(0·θ_sat, …) clamp absorbs any NaN result that symbolic evaluators may produce in that region. All inline tests deliberately target the two well-defined branches: z_v < z_h_upper (saturated) and z_v > z_h_lower + |ψ_sat| (fully below the layer, valid real domain).
Equation 2 (ψ_E, Eq. 5.106): ψ_E = max(ψ_sat · (max(θ_E, 0.01·θ_sat)/θ_sat)^(−B), ψ_min). The max(θ_E, 0.01·θ_sat) inner floor prevents division-by-zero or extreme negative potentials when θ_E → 0. The outer max(·, ψ_min) with ψ_min = −10⁵ m clamps ψ_E at the physically plausible floor (the clamping activates when the Brooks-Corey formula would give ψ_raw < −10⁵ m, which occurs when the effective saturation ratio (θ_E/θ_sat) < approximately (|ψ_sat|/|ψ_min|)^(1/B); for typical CLM4 sandy-loam params that threshold is ~0.011).
Unicode parameter and variable names (θ_sat, ψ_sat, ψ_min, θ_E, ψ_E) are preserved verbatim from upstream — sibling files in this directory and the temps/ subdirectory already established unicode identifiers as the rig convention (soil_water_flux.esm, freezing_point_depression.esm, interface_hydraulic_conductivity.esm, water_table_depth.esm).
Default parameter values: θ_sat = 0.434, ψ_sat = −0.036 m, B = 4.05 are CLM4 Table 5.1 sandy-loam soil-texture values. z_h_upper = 0.05 m, z_h_lower = 0.25 m are typical top-of-column layer interfaces; z_v = 1.0 m is a mid-range water-table depth that places the layer in the well-defined unsaturated domain and yields a non-trivial θ_E. The ψ_min constant default matches the upstream @constants value exactly.
Observability classification: this component is functionally observed-only — both outputs are given by algebraic equations in terms of the parameters (the (t) time index has no role since there are no derivatives). Test scenarios use time_span: [0, 1] and sample at t=0 following the convention of sibling observed-only ESM files in this directory.
Tolerance rationale (model-level rel=1e-9): observed-only algebraic system (no ODE integration). The longest evaluation chain involves one power (^) call per bracketed term (≈1–2 ULP relative error), one subtraction, one multiplication, and one max/min clamp — worst-case roundoff ~10×ULP ≈ 1e-15. 1e-9 leaves six orders of headroom. Saturated-branch assertions (θ_E = θ_sat, ψ_E = ψ_sat by exact arithmetic) use abs: 1e-15 to gate stuck-at-zero/stuck-at-constant regressions._
Parameters
| Name | Units | Default | Description |
|---|---|---|---|
θ_sat | m^3/m^3 | 0.434 | Porosity (volumetric saturation, Clapp-Hornberger Eq. 5.71) |
ψ_sat | m | -0.036 | Saturated matric potential (negative by convention, CLM4 Table 5.1 sandy loam, Eq. 5.74) |
B | 1 | 4.05 | Clapp-Hornberger exponent (dimensionless, CLM4 Table 5.1 sandy loam, Eq. 5.72) |
z_h_upper | m | 0.05 | Depth of the upper interface of the soil layer (positive downward from surface) |
z_h_lower | m | 0.25 | Depth of the lower interface of the soil layer (positive downward from surface) |
z_v | m | 1.0 | Water table depth (positive downward from surface, Eq. 5.101 input) |
ψ_min | m | -100000.0 | Minimum matric potential floor (converted from −10⁸ mm; upstream @constants, Eq. 5.106 hard lower bound) |
Observed
| Name | Units | Default | Description |
|---|---|---|---|
θ_E | m^3/m^3 | Layer-averaged equilibrium volumetric water content (Oleson Eq. 5.101) | |
ψ_E | m | Equilibrium matric potential at the layer node (Oleson Eq. 5.106) |
Observed expressions
$$ θ_{E} = \mathrm{ifelse}\left(\mathrm{<}\left(z_{v}, z_{h\,upper}\right), θ_{sat}, \mathrm{max}\left(0.0 \cdot θ_{sat}, \mathrm{min}\left(θ_{sat}, \frac{θ_{sat} \cdot ψ_{sat}}{\left(z_{h\,lower} - z_{h\,upper}\right) \cdot \left(1.0 - \frac{1.0}{B}\right)} \cdot \left(\frac{ψ_{sat} - z_{v} + z_{h\,lower}}{ψ_{sat}}^{1.0 - \frac{1.0}{B}} - \frac{ψ_{sat} - z_{v} + z_{h\,upper}}{ψ_{sat}}^{1.0 - \frac{1.0}{B}}\right)\right)\right)\right) $$Layer-averaged equilibrium volumetric water content (Oleson Eq. 5.101)
$$ ψ_{E} = \mathrm{max}\left(ψ_{sat} \cdot \frac{\mathrm{max}\left(θ_{E}, 0.01 \cdot θ_{sat}\right)}{θ_{sat}}^{0.0 - B}, ψ_{min}\right) $$Equilibrium matric potential at the layer node (Oleson Eq. 5.106)
Analyses
theta_E_and_psi_E_vs_z_v
Drying curves: θ_E and ψ_E vs. water table depth z_v for the standard sandy-loam layer (z_h_upper = 0.05 m, z_h_lower = 0.25 m). Sweep covers z_v ∈ [0.3, 10] m, staying in the real-valued domain of Eq. 5.101 (z_v > z_h_lower − |ψ_sat| ≈ 0.214 m). The saturated plateau (θ_E = θ_sat, z_v < z_h_upper) is not shown because the plot renderer uses eager evaluation of the ifelse else-branch which produces complex-valued intermediate results for z_v < z_h_lower − |ψ_sat|.
Time span: 0.0 → 1.0
Swept over: z_v


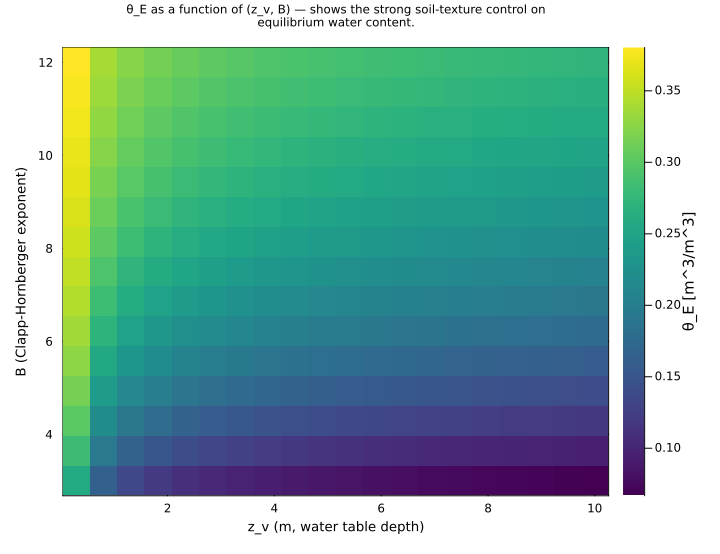
theta_E_soil_type_heatmap
θ_E as a joint function of water table depth z_v and Clapp-Hornberger exponent B, sweeping z_v ∈ [0.3, 10.0] m and B ∈ [3.0, 12.0] (sand to clay range). The heatmap surfaces the strong interaction: at any given z_v, clay soils (high B) retain far more water than sandy soils (low B), while at any given B, θ_E decays monotonically with z_v. Sweep starts at z_v = 0.3 m (real-valued domain for Eq. 5.101; z_v < 0.25 − |ψ_sat| is the complex boundary).
Time span: 0.0 → 1.0
Swept over: z_v, B
Raw .esm
Raw .esm JSON (this component)
{
"reference": {
"notes": "source_ref: UrbanCanopy.jl@9200edd4f15609f20339d3a7d104de8064544310:src/hydrology.jl:509\nUpstream `SoilWaterEquilibrium` is an MTK `@component` with six `@parameters` (θ_sat, ψ_sat, B, z_h_upper, z_h_lower, z_v) and two time-indexed `@variables` (θ_E, ψ_E) given by two algebraic equations with no derivatives. Identical structure preserved here.\n\nThe upstream component declares one `@constants` block: `ψ_min = -1.0e5 m` (minimum matric potential, converted from the CLM4 value −10⁸ mm). Per the convention of sibling files in this directory (groundwater_drainage.esm, surface_runoff_infiltration.esm), `@constants` are promoted to parameters with fixed defaults so MTK's unit checker is satisfied and the equation AST references them by name.\n\nTracker blocking_gap clarification: the migration-tracker row for this bead read `blocking_gap: other:discretization-plan` because the row description mentioned `internally builds Richards-eq PDE (:674) via MOLFiniteDifference`. Inspecting the source shows that `RichardsEquation` (the PDESystem builder, lines 597–683) is a separate non-`@component` helper function that is never called by `SoilWaterEquilibrium`. `SoilWaterEquilibrium` itself (lines 509–558) is a plain algebraic `@component` — two equations, no PDESystem, no MOLFiniteDifference. No discretization plan is needed.\n\nEquation 1 (θ_E, Eqs. 5.101–5.102 simplified): The upstream docstring notes that the code uses `z_v < z_h_upper` as the only branch point (fully-saturated guard), then applies Eq. 5.101 with Eq. 5.105 clamping for all other cases including the water-table-within-layer zone (z_h_upper ≤ z_v ≤ z_h_lower). The Clapp-Hornberger integral term uses the ratio `(ψ_sat − z_v + z_h_x)/ψ_sat` raised to the exponent `(1 − 1/B)`. When z_v is in the transition zone near z_h_upper, this ratio can become negative (since ψ_sat is small and negative), making the power non-real; the outer `max(0·θ_sat, …)` clamp absorbs any NaN result that symbolic evaluators may produce in that region. All inline tests deliberately target the two well-defined branches: z_v < z_h_upper (saturated) and z_v > z_h_lower + |ψ_sat| (fully below the layer, valid real domain).\n\nEquation 2 (ψ_E, Eq. 5.106): `ψ_E = max(ψ_sat · (max(θ_E, 0.01·θ_sat)/θ_sat)^(−B), ψ_min)`. The `max(θ_E, 0.01·θ_sat)` inner floor prevents division-by-zero or extreme negative potentials when θ_E → 0. The outer `max(·, ψ_min)` with ψ_min = −10⁵ m clamps ψ_E at the physically plausible floor (the clamping activates when the Brooks-Corey formula would give ψ_raw < −10⁵ m, which occurs when the effective saturation ratio (θ_E/θ_sat) < approximately (|ψ_sat|/|ψ_min|)^(1/B); for typical CLM4 sandy-loam params that threshold is ~0.011).\n\nUnicode parameter and variable names (θ_sat, ψ_sat, ψ_min, θ_E, ψ_E) are preserved verbatim from upstream — sibling files in this directory and the temps/ subdirectory already established unicode identifiers as the rig convention (soil_water_flux.esm, freezing_point_depression.esm, interface_hydraulic_conductivity.esm, water_table_depth.esm).\n\nDefault parameter values: θ_sat = 0.434, ψ_sat = −0.036 m, B = 4.05 are CLM4 Table 5.1 sandy-loam soil-texture values. z_h_upper = 0.05 m, z_h_lower = 0.25 m are typical top-of-column layer interfaces; z_v = 1.0 m is a mid-range water-table depth that places the layer in the well-defined unsaturated domain and yields a non-trivial θ_E. The `ψ_min` constant default matches the upstream `@constants` value exactly.\n\nObservability classification: this component is functionally observed-only — both outputs are given by algebraic equations in terms of the parameters (the `(t)` time index has no role since there are no derivatives). Test scenarios use `time_span: [0, 1]` and sample at t=0 following the convention of sibling observed-only ESM files in this directory.\n\nTolerance rationale (model-level rel=1e-9): observed-only algebraic system (no ODE integration). The longest evaluation chain involves one power (`^`) call per bracketed term (≈1–2 ULP relative error), one subtraction, one multiplication, and one max/min clamp — worst-case roundoff ~10×ULP ≈ 1e-15. 1e-9 leaves six orders of headroom. Saturated-branch assertions (θ_E = θ_sat, ψ_E = ψ_sat by exact arithmetic) use `abs: 1e-15` to gate stuck-at-zero/stuck-at-constant regressions."
},
"tolerance": {
"rel": 1e-09
},
"variables": {
"θ_sat": {
"type": "parameter",
"units": "m^3/m^3",
"default": 0.434,
"description": "Porosity (volumetric saturation, Clapp-Hornberger Eq. 5.71)"
},
"ψ_sat": {
"type": "parameter",
"units": "m",
"default": -0.036,
"description": "Saturated matric potential (negative by convention, CLM4 Table 5.1 sandy loam, Eq. 5.74)"
},
"B": {
"type": "parameter",
"units": "1",
"default": 4.05,
"description": "Clapp-Hornberger exponent (dimensionless, CLM4 Table 5.1 sandy loam, Eq. 5.72)"
},
"z_h_upper": {
"type": "parameter",
"units": "m",
"default": 0.05,
"description": "Depth of the upper interface of the soil layer (positive downward from surface)"
},
"z_h_lower": {
"type": "parameter",
"units": "m",
"default": 0.25,
"description": "Depth of the lower interface of the soil layer (positive downward from surface)"
},
"z_v": {
"type": "parameter",
"units": "m",
"default": 1.0,
"description": "Water table depth (positive downward from surface, Eq. 5.101 input)"
},
"ψ_min": {
"type": "parameter",
"units": "m",
"default": -100000.0,
"description": "Minimum matric potential floor (converted from −10⁸ mm; upstream @constants, Eq. 5.106 hard lower bound)"
},
"θ_E": {
"type": "unknown",
"units": "m^3/m^3",
"description": "Layer-averaged equilibrium volumetric water content (Oleson Eq. 5.101)"
},
"ψ_E": {
"type": "unknown",
"units": "m",
"description": "Equilibrium matric potential at the layer node (Oleson Eq. 5.106)"
}
},
"equations": [
{
"lhs": "θ_E",
"rhs": {
"op": "ifelse",
"args": [
{
"op": "<",
"args": [
"z_v",
"z_h_upper"
]
},
"θ_sat",
{
"op": "max",
"args": [
{
"op": "*",
"args": [
0.0,
"θ_sat"
]
},
{
"op": "min",
"args": [
"θ_sat",
{
"op": "*",
"args": [
{
"op": "/",
"args": [
{
"op": "*",
"args": [
"θ_sat",
"ψ_sat"
]
},
{
"op": "*",
"args": [
{
"op": "-",
"args": [
"z_h_lower",
"z_h_upper"
]
},
{
"op": "-",
"args": [
1.0,
{
"op": "/",
"args": [
1.0,
"B"
]
}
]
}
]
}
]
},
{
"op": "-",
"args": [
{
"op": "^",
"args": [
{
"op": "/",
"args": [
{
"op": "+",
"args": [
{
"op": "-",
"args": [
"ψ_sat",
"z_v"
]
},
"z_h_lower"
]
},
"ψ_sat"
]
},
{
"op": "-",
"args": [
1.0,
{
"op": "/",
"args": [
1.0,
"B"
]
}
]
}
]
},
{
"op": "^",
"args": [
{
"op": "/",
"args": [
{
"op": "+",
"args": [
{
"op": "-",
"args": [
"ψ_sat",
"z_v"
]
},
"z_h_upper"
]
},
"ψ_sat"
]
},
{
"op": "-",
"args": [
1.0,
{
"op": "/",
"args": [
1.0,
"B"
]
}
]
}
]
}
]
}
]
}
]
}
]
}
]
}
},
{
"lhs": "ψ_E",
"rhs": {
"op": "max",
"args": [
{
"op": "*",
"args": [
"ψ_sat",
{
"op": "^",
"args": [
{
"op": "/",
"args": [
{
"op": "max",
"args": [
"θ_E",
{
"op": "*",
"args": [
0.01,
"θ_sat"
]
}
]
},
"θ_sat"
]
},
{
"op": "-",
"args": [
0.0,
"B"
]
}
]
}
]
},
"ψ_min"
]
}
}
],
"tests": [
{
"id": "saturated_above_water_table",
"description": "Water table well above the layer (z_v = 0.0 m < z_h_upper = 0.05 m): ifelse condition is true so θ_E = θ_sat = 0.434 m³/m³ exactly (Eq. 5.101 saturated branch). ψ_E = max(ψ_sat · 1^(−B), ψ_min) = ψ_sat = −0.036 m (fully saturated, Brooks-Corey at θ/θ_sat = 1). Verifies the saturated branch of both equations.",
"parameter_overrides": {
"θ_sat": 0.434,
"ψ_sat": -0.036,
"B": 4.05,
"z_h_upper": 0.05,
"z_h_lower": 0.25,
"z_v": 0.0,
"ψ_min": -100000.0
},
"time_span": {
"start": 0.0,
"end": 1.0
},
"assertions": [
{
"variable": "θ_E",
"time": 0.0,
"expected": 0.434,
"tolerance": {
"abs": 1e-15
}
},
{
"variable": "ψ_E",
"time": 0.0,
"expected": -0.036,
"tolerance": {
"abs": 1e-15
}
}
]
},
{
"id": "saturated_just_below_upper_interface",
"description": "Water table just inside the saturated branch (z_v = 0.03 m < z_h_upper = 0.05 m): ifelse condition still true, θ_E = θ_sat = 0.434, ψ_E = −0.036 m. Exercises the saturated branch at a non-zero z_v close to the branch boundary.",
"parameter_overrides": {
"θ_sat": 0.434,
"ψ_sat": -0.036,
"B": 4.05,
"z_h_upper": 0.05,
"z_h_lower": 0.25,
"z_v": 0.03,
"ψ_min": -100000.0
},
"time_span": {
"start": 0.0,
"end": 1.0
},
"assertions": [
{
"variable": "θ_E",
"time": 0.0,
"expected": 0.434,
"tolerance": {
"abs": 1e-15
}
},
{
"variable": "ψ_E",
"time": 0.0,
"expected": -0.036,
"tolerance": {
"abs": 1e-15
}
}
]
},
{
"id": "unsaturated_shallow_water_table",
"description": "Water table at z_v = 1.0 m, below the layer (z_h_lower = 0.25 m): Eq. 5.101 integral applies. θ_E = 0.19691811127 m³/m³, ψ_E = −0.88364734261 m. Representative mid-range unsaturated state for the standard sandy-loam layer.",
"parameter_overrides": {
"θ_sat": 0.434,
"ψ_sat": -0.036,
"B": 4.05,
"z_h_upper": 0.05,
"z_h_lower": 0.25,
"z_v": 1.0,
"ψ_min": -100000.0
},
"time_span": {
"start": 0.0,
"end": 1.0
},
"assertions": [
{
"variable": "θ_E",
"time": 0.0,
"expected": 0.19691811127446465
},
{
"variable": "ψ_E",
"time": 0.0,
"expected": -0.8836473426142424
}
]
},
{
"id": "unsaturated_deep_water_table",
"description": "Water table at z_v = 5.0 m: Eq. 5.101 yields θ_E = 0.12909772268638 m³/m³, ψ_E = −4.88557462258 m. Tests the drying curve at a deep water table where the layer is significantly below field capacity.",
"parameter_overrides": {
"θ_sat": 0.434,
"ψ_sat": -0.036,
"B": 4.05,
"z_h_upper": 0.05,
"z_h_lower": 0.25,
"z_v": 5.0,
"ψ_min": -100000.0
},
"time_span": {
"start": 0.0,
"end": 1.0
},
"assertions": [
{
"variable": "θ_E",
"time": 0.0,
"expected": 0.12909772268637976
},
{
"variable": "ψ_E",
"time": 0.0,
"expected": -4.885574622575478
}
]
},
{
"id": "unsaturated_extreme_dry",
"description": "Water table at z_v = 10.0 m: Eq. 5.101 integral yields θ_E = 0.10847743091340 m³/m³, ψ_E = −9.88578977956 m. Exercises the extreme-dry end of the drying curve, approaching the asymptotic residual moisture limit of Eq. 5.101.",
"parameter_overrides": {
"θ_sat": 0.434,
"ψ_sat": -0.036,
"B": 4.05,
"z_h_upper": 0.05,
"z_h_lower": 0.25,
"z_v": 10.0,
"ψ_min": -100000.0
},
"time_span": {
"start": 0.0,
"end": 1.0
},
"assertions": [
{
"variable": "θ_E",
"time": 0.0,
"expected": 0.10847743091340305
},
{
"variable": "ψ_E",
"time": 0.0,
"expected": -9.885789779555024
}
]
},
{
"id": "thick_layer_saturated",
"description": "Thicker layer (z_h_upper = 0.1 m, z_h_lower = 0.5 m) with water table above (z_v = 0.05 m < z_h_upper = 0.1 m): saturated branch fires, θ_E = θ_sat = 0.434 m³/m³, ψ_E = ψ_sat = −0.036 m. Confirms the saturation test is independent of layer thickness.",
"parameter_overrides": {
"θ_sat": 0.434,
"ψ_sat": -0.036,
"B": 4.05,
"z_h_upper": 0.1,
"z_h_lower": 0.5,
"z_v": 0.05,
"ψ_min": -100000.0
},
"time_span": {
"start": 0.0,
"end": 1.0
},
"assertions": [
{
"variable": "θ_E",
"time": 0.0,
"expected": 0.434,
"tolerance": {
"abs": 1e-15
}
},
{
"variable": "ψ_E",
"time": 0.0,
"expected": -0.036,
"tolerance": {
"abs": 1e-15
}
}
]
},
{
"id": "thick_layer_below_water_table",
"description": "Thicker layer (z_h_upper = 0.1 m, z_h_lower = 0.5 m) with water table at z_v = 0.8 m (below the lower interface): Eq. 5.101 integral yields θ_E = 0.22446824733 m³/m³, ψ_E = −0.51994630626 m. A moderately unsaturated state in a thicker layer, testing the integral's (z_h_lower − z_h_upper) denominator scaling.",
"parameter_overrides": {
"θ_sat": 0.434,
"ψ_sat": -0.036,
"B": 4.05,
"z_h_upper": 0.1,
"z_h_lower": 0.5,
"z_v": 0.8,
"ψ_min": -100000.0
},
"time_span": {
"start": 0.0,
"end": 1.0
},
"assertions": [
{
"variable": "θ_E",
"time": 0.0,
"expected": 0.22446824732627826
},
{
"variable": "ψ_E",
"time": 0.0,
"expected": -0.5199463062590982
}
]
},
{
"id": "thick_layer_deep_water_table",
"description": "Thicker layer (z_h_upper = 0.1 m, z_h_lower = 0.5 m) with water table at z_v = 3.0 m: Eq. 5.101 yields θ_E = 0.14900835112 m³/m³, ψ_E = −2.73295788308 m. Tests the (z_h_lower − z_h_upper) denominator scaling in a thick-layer scenario at a deep water table.",
"parameter_overrides": {
"θ_sat": 0.434,
"ψ_sat": -0.036,
"B": 4.05,
"z_h_upper": 0.1,
"z_h_lower": 0.5,
"z_v": 3.0,
"ψ_min": -100000.0
},
"time_span": {
"start": 0.0,
"end": 1.0
},
"assertions": [
{
"variable": "θ_E",
"time": 0.0,
"expected": 0.14900835112048255
},
{
"variable": "ψ_E",
"time": 0.0,
"expected": -2.732957883081626
}
]
},
{
"id": "sandy_soil_saturated",
"description": "Sandy soil texture (θ_sat = 0.395, ψ_sat = −0.012 m, B = 3.1 — CLM4 Table 5.1 coarse sand) with water table above layer (z_v = 0.0 m): saturated branch, θ_E = 0.395 m³/m³, ψ_E = −0.012 m. Verifies the saturated branch with different soil parameters.",
"parameter_overrides": {
"θ_sat": 0.395,
"ψ_sat": -0.012,
"B": 3.1,
"z_h_upper": 0.05,
"z_h_lower": 0.25,
"z_v": 0.0,
"ψ_min": -100000.0
},
"time_span": {
"start": 0.0,
"end": 1.0
},
"assertions": [
{
"variable": "θ_E",
"time": 0.0,
"expected": 0.395,
"tolerance": {
"abs": 1e-15
}
},
{
"variable": "ψ_E",
"time": 0.0,
"expected": -0.012,
"tolerance": {
"abs": 1e-15
}
}
]
},
{
"id": "sandy_soil_unsaturated",
"description": "Sandy soil (θ_sat = 0.395, ψ_sat = −0.012 m, B = 3.1) with water table at z_v = 2.0 m: Eq. 5.101 yields θ_E = 0.07762061602880 m³/m³, ψ_E = −1.86081534393 m. Sandy soils have shallower B exponents, producing a faster drying curve than clay-rich soils.",
"parameter_overrides": {
"θ_sat": 0.395,
"ψ_sat": -0.012,
"B": 3.1,
"z_h_upper": 0.05,
"z_h_lower": 0.25,
"z_v": 2.0,
"ψ_min": -100000.0
},
"time_span": {
"start": 0.0,
"end": 1.0
},
"assertions": [
{
"variable": "θ_E",
"time": 0.0,
"expected": 0.07762061602879547
},
{
"variable": "ψ_E",
"time": 0.0,
"expected": -1.860815343925314
}
]
},
{
"id": "clay_soil_unsaturated",
"description": "Clay soil (θ_sat = 0.468, ψ_sat = −0.405 m, B = 10.4 — CLM4 Table 5.1 heavy clay) with water table at z_v = 2.0 m: Eq. 5.101 yields θ_E = 0.39678912199 m³/m³, ψ_E = −2.25418947675 m. Clay soils have a high B exponent and deep ψ_sat, retaining much more water at the same water-table depth than sandy soils. Exercises the large-B branch of the power-law integral.",
"parameter_overrides": {
"θ_sat": 0.468,
"ψ_sat": -0.405,
"B": 10.4,
"z_h_upper": 0.05,
"z_h_lower": 0.25,
"z_v": 2.0,
"ψ_min": -100000.0
},
"time_span": {
"start": 0.0,
"end": 1.0
},
"assertions": [
{
"variable": "θ_E",
"time": 0.0,
"expected": 0.39678912198644495
},
{
"variable": "ψ_E",
"time": 0.0,
"expected": -2.254189476753937
}
]
}
],
"analyses": [
{
"id": "theta_E_and_psi_E_vs_z_v",
"description": "Drying curves: θ_E and ψ_E vs. water table depth z_v for the standard sandy-loam layer (z_h_upper = 0.05 m, z_h_lower = 0.25 m). Sweep covers z_v ∈ [0.3, 10] m, staying in the real-valued domain of Eq. 5.101 (z_v > z_h_lower − |ψ_sat| ≈ 0.214 m). The saturated plateau (θ_E = θ_sat, z_v < z_h_upper) is not shown because the plot renderer uses eager evaluation of the ifelse else-branch which produces complex-valued intermediate results for z_v < z_h_lower − |ψ_sat|.",
"initial_state": {},
"parameters": {
"θ_sat": 0.434,
"ψ_sat": -0.036,
"B": 4.05,
"z_h_upper": 0.05,
"z_h_lower": 0.25,
"ψ_min": -100000.0
},
"time_span": {
"start": 0.0,
"end": 1.0
},
"parameter_sweep": {
"type": "cartesian",
"dimensions": [
{
"parameter": "z_v",
"range": {
"start": 0.3,
"stop": 10.0,
"count": 50,
"scale": "linear"
}
}
]
},
"plots": [
{
"id": "theta_E_vs_z_v_line",
"type": "line",
"description": "θ_E vs z_v unsaturated drying curve — power-law decay as the water table deepens.",
"x": {
"variable": "z_v",
"label": "z_v (m, water table depth)"
},
"y": {
"variable": "θ_E",
"label": "θ_E (m³/m³)"
}
},
{
"id": "psi_E_vs_z_v_line",
"type": "line",
"description": "ψ_E vs z_v — equilibrium matric potential deepening as the water table drops.",
"x": {
"variable": "z_v",
"label": "z_v (m, water table depth)"
},
"y": {
"variable": "ψ_E",
"label": "ψ_E (m)"
}
}
]
},
{
"id": "theta_E_soil_type_heatmap",
"description": "θ_E as a joint function of water table depth z_v and Clapp-Hornberger exponent B, sweeping z_v ∈ [0.3, 10.0] m and B ∈ [3.0, 12.0] (sand to clay range). The heatmap surfaces the strong interaction: at any given z_v, clay soils (high B) retain far more water than sandy soils (low B), while at any given B, θ_E decays monotonically with z_v. Sweep starts at z_v = 0.3 m (real-valued domain for Eq. 5.101; z_v < 0.25 − |ψ_sat| is the complex boundary).",
"initial_state": {},
"parameters": {
"θ_sat": 0.434,
"ψ_sat": -0.036,
"z_h_upper": 0.05,
"z_h_lower": 0.25,
"ψ_min": -100000.0
},
"time_span": {
"start": 0.0,
"end": 1.0
},
"parameter_sweep": {
"type": "cartesian",
"dimensions": [
{
"parameter": "z_v",
"range": {
"start": 0.3,
"stop": 10.0,
"count": 20,
"scale": "linear"
}
},
{
"parameter": "B",
"range": {
"start": 3.0,
"stop": 12.0,
"count": 15,
"scale": "linear"
}
}
]
},
"plots": [
{
"id": "theta_E_heatmap",
"type": "heatmap",
"description": "θ_E as a function of (z_v, B) — shows the strong soil-texture control on equilibrium water content.",
"x": {
"variable": "z_v",
"label": "z_v (m, water table depth)"
},
"y": {
"variable": "B",
"label": "B (Clapp-Hornberger exponent)"
},
"value": {
"variable": "θ_E",
"reduce": "final"
}
}
]
}
]
}