StagePrognosis
Stochastic individual-tree growth model for lodgepole pine (Pinus contorta) based on the Prognosis Model for Stand Development (Stage 1973). Tracks squared diameter (Dsq = DBH²), total height (HT), height to crown base (HCB), and tree density (N_trees) under four coupled processes: basal area increment (Stage 1973 Eq. 1), height growth (Eq. 2), crown recession (Eq. 3), and endemic mortality (Eq. 4). The upstream Julia source includes a multiplicative Brownian noise term on DDS_rate (gt-kuxo gap); this ESM migrates the deterministic drift equations only. All quantities in SI base units (m, s); upstream regression fitted in imperial units (inches, feet, years) — parameters encode the conversion constants. Migrated from Vegetation.jl@010c3774dc5646d81806c6119c8a029a70f6c9a0:src/stage_prognosis.jl:29.
Description
Stochastic individual-tree growth model for lodgepole pine (Pinus contorta) based on the Prognosis Model for Stand Development (Stage 1973). Tracks squared diameter (Dsq = DBH²), total height (HT), height to crown base (HCB), and tree density (N_trees) under four coupled processes: basal area increment (Stage 1973 Eq. 1), height growth (Eq. 2), crown recession (Eq. 3), and endemic mortality (Eq. 4). The upstream Julia source includes a multiplicative Brownian noise term on DDS_rate (gt-kuxo gap); this ESM migrates the deterministic drift equations only. All quantities in SI base units (m, s); upstream regression fitted in imperial units (inches, feet, years) — parameters encode the conversion constants. Migrated from Vegetation.jl@010c3774dc5646d81806c6119c8a029a70f6c9a0:src/stage_prognosis.jl:29.
Reference
Stage, A.R. (1973). Prognosis model for stand development. USDA Forest Service Research Paper INT-137.
_source_ref: Vegetation.jl@010c3774dc5646d81806c6119c8a029a70f6c9a0:src/stage_prognosis.jl:29
Upstream StagePrognosis is an MTK @component implementing Stage (1973). It declares 4 ODE state @variables (Dsq, HT, HCB, N_trees), 8 algebraic @variables (DBH, CR, DDS_rate, DG, HTGF_rate, crown_recession_rate, mortality_rate, mean_DBH_in), 1 @brownians B_growth (Wiener noise for stochastic diameter growth), and two @constants blocks plus one @parameters block. The presence of B_growth promotes the MTK system to an SDESystem.
Upstream @constants are preserved as parameters with their fixed defaults — same pattern as components/vegetation/landis_biomass.esm — so the standalone ESM model is fully self-contained. The parameter sigma_growth corresponds to Julia’s σ_growth = 0.3 * sqrt(3.15576e7) ≈ 1685.28 (dimensionless); setting it to 0 recovers the deterministic limit used in the inline tests.
Key equations (Stage 1973 equation numbering): Eq. 1: DDS_rate = BKR * (in²/yr) * exp(b0 + b1ln(SI_ft) + b2EL_hft + b3ln(CCF) + b4ln(CR) + b5ln(DBH_in) + b6PCT) [diameter squared growth rate, converted to m²/s] Eq. 2: HTGF_rate = (ft/yr) * exp(c1 + c2ln(DG+0.05) + c3ln(DBH_in) + c4ln(HT_ft)) [height growth rate, m/s] Eq. 3: crown_recession_rate = (0.20 or 0.61)HTGF_rate [CCF threshold at 125] Eq. 4: mortality_rate = (1/yr) * (a0 + a1DBH_mean_in + a2DBH_mean_in²) * (0.25 + 1.5*(1 - PCT/100)) [Lee 1971] SDE: D(Dsq) = DDS_rate + sigma_growth * |DDS_rate| * B_growth [multiplicative noise]
Tolerance rationale (rel=1e-4): all RHS terms involve smooth transcendental functions of bounded state variables; with sigma_growth=0 the system is a well-posed ODE. The nested exp/log structure produces moderate condition numbers — rel=1e-4 gives comfortable margin above integration error while staying well within the physical uncertainty of Stage’s empirical regression (~10-15% RMS residual in log-space).
TODO_GAP: gt-kuxo — Upstream Julia component uses @brownians B_growth to add multiplicative Wiener noise to the diameter growth equation:
D(Dsq) ~ DDS_rate + sigma_growth * abs(DDS_rate) * B_growth
The ESM schema v0.4.0 has no brownian variable type (gap gt-kuxo). This ESM migrates the deterministic drift only: D(Dsq) = DDS_rate. sigma_growth is preserved as a structural parameter (default=0.0 for deterministic operation). When gt-kuxo is resolved, add B_growth as a type: brownian variable and restore the full SDE equation._
Variables
| Name | Units | Default | Description |
|---|---|---|---|
Dsq | m^2 | 0.02322576 | Squared diameter at breast height (DBH²) in m². Carried as state variable because basal area increment is most naturally linear in diameter-squared space. Default: (6 in)² = (6 * 0.0254 m)² = 0.02322576 m². |
HT | m | 18.288 | Total tree height in meters. Default 60 ft = 60 * 0.3048 = 18.288 m (Stage 1973 example, p. 5). |
HCB | m | 12.192 | Height to crown base in meters. Default 40 ft = 40 * 0.3048 = 12.192 m, giving initial crown ratio CR = 1/3. |
N_trees | m^-2 | 0.12355445 | Tree density in trees per m². Default 500 trees/acre = 500 / 4046.86 ≈ 0.12355 m^-2 (Stage 1973 example, p. 5). |
Parameters
| Name | Units | Default | Description |
|---|---|---|---|
one_inch | m | 0.0254 | Reference length: 1 inch in meters. Converts SI lengths to the inches used in Stage (1973) regression coefficients. |
one_foot | m | 0.3048 | Reference length: 1 foot in meters. Converts SI lengths to the feet used in Stage (1973) site index and height regressions. |
hundred_feet | m | 30.48 | Reference length: 100 feet in meters. Converts elevation to the hundreds-of-feet units in the DDS regression. |
one_inch_sq | m^2 | 0.00064516 | Reference area: 1 square inch in m². Converts DDS from in²/yr to m²/yr in the basal area increment equation. |
one_year | s | 31557600.0 | Reference time: 1 year in seconds (365.25 days). Converts annual rates to per-second rates throughout. |
b_DDS_0 | 1 | -1.66955 | DDS regression intercept (Stage 1973, p. 15, dimensionless). |
b_DDS_SI | 1 | 0.4143 | DDS coefficient on ln(SI in feet) (Stage 1973, p. 15, dimensionless). |
b_DDS_EL | 1 | -0.004388 | DDS coefficient on elevation in hundreds of feet (Stage 1973, p. 15, dimensionless). |
b_DDS_CCF | 1 | -0.3781 | DDS coefficient on ln(CCF) (Stage 1973, p. 15, dimensionless). Negative: higher competition reduces growth. |
b_DDS_CR | 1 | 0.4879 | DDS coefficient on ln(crown ratio CR) (Stage 1973, p. 15, dimensionless). |
b_DDS_DBH | 1 | 0.9948 | DDS coefficient on ln(DBH in inches) (Stage 1973, p. 15, dimensionless). Near 1.0: growth scales roughly linearly with DBH. |
b_DDS_PCT | 1 | 0.006141 | DDS coefficient on percentile PCT (Stage 1973, p. 15, dimensionless). Positive: dominant trees grow faster. |
crown_recess_low | 1 | 0.2 | Crown recession fraction when CCF < 125: crown base rises at 1/5 of height growth rate (Stage 1973, p. 16). |
crown_recess_high | 1 | 0.61 | Crown recession fraction when CCF >= 125: crown base rises at 0.61 of height growth rate (Stage 1973, p. 16). |
CCF_threshold | 1 | 125.0 | Crown competition factor threshold separating low and high crown recession regimes (Stage 1973, p. 16). |
mort_a0 | 1 | 0.0536 | Mortality intercept (Lee 1971 via Stage 1973, p. 16-17). Annual rate at mean DBH = 0, dimensionless. |
mort_a1 | 1 | -0.0088 | Mortality linear coefficient on mean DBH in inches (Lee 1971 via Stage 1973, p. 16-17). Negative: larger stands have lower base mortality. |
mort_a2 | 1 | 0.000415 | Mortality quadratic coefficient on mean DBH² in inches² (Lee 1971 via Stage 1973, p. 16-17). Minimum at DBH ≈ 10.6 inches. |
CR_min | 1 | 0.01 | Minimum crown ratio floor to prevent log(0) in DDS regression (dimensionless). |
DG_min | 1 | 0.001 | Minimum diameter growth increment floor in inches-space to prevent log(0) in height growth regression (dimensionless). |
DG_offset | 1 | 0.05 | Offset added to DG before log transform in height growth regression: ln(DG + 0.05) (Stage 1973, p. 15-16). |
zero_rate | 1/s | 0.0 | Zero rate used as floor in max() for mortality (prevents negative mortality rates). |
one_rate_per_year | 1/s | 3.170979198376459e-08 | Unit annual rate converted to per-second: 1 / 3.15576e7. Converts annual mortality coefficients to SI units. |
mort_base_factor | 1 | 0.25 | Base mortality distribution factor for dominant trees (PCT=100): mortality = base_rate * 0.25 (Stage 1973, p. 17). |
mort_scale_factor | 1 | 1.5 | Mortality distribution scale: factor = 0.25 + 1.5*(1 - PCT/100), ranging from 0.25 (dominant) to 1.75 (suppressed, Stage 1973, p. 17). |
mort_pct_one | 1 | 1.0 | Unity constant for PCT normalization in mortality distribution factor: (1 - PCT/100). |
mort_pct_max | 1 | 100.0 | Maximum percentile value for PCT normalization in mortality distribution factor. |
SI | m | 24.384 | Site index: dominant stand height at base age, in meters. Default 80 ft = 80 * 0.3048 m (Stage 1973 example, p. 5). |
EL | m | 1310.64 | Elevation above sea level in meters. Default 4300 ft = 43 * 30.48 m (Stage 1973 example, p. 5). |
CCF | 1 | 100.0 | Crown competition factor: dimensionless index of stand density (Krajicek 1961). Default 100 corresponds to fully-stocked stand. |
PCT | 1 | 50.0 | Percentile of tree in basal area distribution (0 = smallest, 100 = largest). Affects both growth (DDS) and mortality. |
RMSQD | m | 0.1778 | Diameter of the tree of mean basal area in the stand, in meters. Default 7 in = 7 * 0.0254 m. |
BKR | 1 | 1.0 | Bark ratio (dob/dib)²: ratio of outside-bark to inside-bark diameter squared. Default 1.0 neglects bark thickness. |
c1_ht | 1 | 0.0 | Height increment intercept coefficient (Cole & Stage, in preparation, referenced in Stage 1973, p. 15-16). Dimensionless. |
c2_ht | 1 | 0.5 | Height increment coefficient on ln(DG + 0.05) (Cole & Stage, in preparation). Dimensionless. |
c3_ht | 1 | -0.1 | Height increment coefficient on ln(DBH in inches) (Cole & Stage, in preparation). Negative: taller/larger trees grow proportionally less in height. |
c4_ht | 1 | 0.2 | Height increment coefficient on ln(HT in feet) (Cole & Stage, in preparation). Positive: taller trees grow more in height. |
mean_DBH | m | 0.1778 | Stand mean DBH for mortality calculation in meters. Default 7 in = 7 * 0.0254 m. Matches RMSQD default. |
sigma_growth | 1 | 0.0 | Scaled standard deviation of stochastic growth noise: 0.3 * sqrt(one_year) = 0.3 * sqrt(3.15576e7) ≈ 1685.28 in the upstream Julia SDE. Retained as a structural parameter but not used in the deterministic equation (see TODO_GAP: gt-kuxo). Default is 0.0 (deterministic limit). |
Observed
| Name | Units | Default | Description |
|---|---|---|---|
DBH | m | Diameter at breast height in meters. Algebraic: DBH = sqrt(Dsq). | |
CR | 1 | Crown ratio (live crown length / total height). Algebraic: CR = max(CR_min, (HT - HCB) / HT). Bounded below by CR_min to prevent log(0) in DDS regression. | |
DDS_rate | m^2/s | Rate of change of squared diameter (basal area increment rate) in m²/s. Algebraic: BKR * (1 in²/yr) * exp(Stage 1973 Eq. 1 regression). Drift term in the D(Dsq) SDE. | |
DG | 1 | Periodic diameter increment in inches-space (dimensionless ratio: new_DBH_in - old_DBH_in). Derived from DDS_rate * one_year to connect the annual DDS to the height-growth regression (Stage 1973, p. 15-16). Floored at DG_min. | |
HTGF_rate | m/s | Height growth rate in m/s. Algebraic: (1 ft/yr) * exp(Cole & Stage regression on DG, DBH_in, HT_ft). Drift term in D(HT). | |
crown_recession_rate | m/s | Rate of crown base rise in m/s. Algebraic: fraction * HTGF_rate, where fraction = 0.20 if CCF < 125 (open-stand regime) or 0.61 if CCF >= 125 (dense-stand regime) (Stage 1973, p. 16). Drift term in D(HCB). | |
mortality_rate | 1/s | Per-capita mortality rate in s^-1. Algebraic: (1/yr) * Lee(mean_DBH_in) * percentile_factor(PCT), floored at zero (Stage 1973, Eq. 4 from Lee 1971). | |
mean_DBH_in | 1 | Stand mean DBH in inches (dimensionless): mean_DBH / one_inch. Used in the Lee (1971) mortality regression. |
Observed expressions
$$ DBH = \sqrt{Dsq} $$Diameter at breast height in meters. Algebraic: DBH = sqrt(Dsq).
$$ CR = \mathrm{max}\left(CR_{min}, \frac{HT + \left(-1\right) \cdot HCB}{HT}\right) $$Crown ratio (live crown length / total height). Algebraic: CR = max(CR_min, (HT - HCB) / HT). Bounded below by CR_min to prevent log(0) in DDS regression.
$$ DDS_{rate} = \frac{BKR \cdot one_{inch\,sq}}{one_{year}} \cdot e^{b_{DDS\,0} + b_{DDS\,SI} \cdot \ln\left(\frac{SI}{one_{foot}}\right) + b_{DDS\,EL} \cdot \frac{EL}{hundred_{feet}} + b_{DDS\,CCF} \cdot \ln\left(CCF\right) + b_{DDS\,CR} \cdot \ln\left(CR\right) + b_{DDS\,DBH} \cdot \ln\left(\frac{DBH}{one_{inch}}\right) + b_{DDS\,PCT} \cdot PCT} $$Rate of change of squared diameter (basal area increment rate) in m²/s. Algebraic: BKR * (1 in²/yr) * exp(Stage 1973 Eq. 1 regression). Drift term in the D(Dsq) SDE.
$$ DG = \mathrm{max}\left(DG_{min}, \sqrt{\frac{DBH}{one_{inch}}^{2} + \frac{DDS_{rate} \cdot one_{year}}{one_{inch\,sq}}} + \left(-1\right) \cdot \frac{DBH}{one_{inch}}\right) $$Periodic diameter increment in inches-space (dimensionless ratio: new_DBH_in - old_DBH_in). Derived from DDS_rate * one_year to connect the annual DDS to the height-growth regression (Stage 1973, p. 15-16). Floored at DG_min.
$$ HTGF_{rate} = \frac{one_{foot}}{one_{year}} \cdot e^{c1_{ht} + c2_{ht} \cdot \ln\left(DG + DG_{offset}\right) + c3_{ht} \cdot \ln\left(\frac{DBH}{one_{inch}}\right) + c4_{ht} \cdot \ln\left(\frac{HT}{one_{foot}}\right)} $$Height growth rate in m/s. Algebraic: (1 ft/yr) * exp(Cole & Stage regression on DG, DBH_in, HT_ft). Drift term in D(HT).
$$ crown_{recession\,rate} = \mathrm{ifelse}\left(\mathrm{<}\left(CCF, CCF_{threshold}\right), crown_{recess\,low} \cdot HTGF_{rate}, crown_{recess\,high} \cdot HTGF_{rate}\right) $$Rate of crown base rise in m/s. Algebraic: fraction * HTGF_rate, where fraction = 0.20 if CCF < 125 (open-stand regime) or 0.61 if CCF >= 125 (dense-stand regime) (Stage 1973, p. 16). Drift term in D(HCB).
$$ mortality_{rate} = \mathrm{max}\left(zero_{rate}, one_{rate\,per\,year} \cdot \left(mort_{a0} + mort_{a1} \cdot mean_{DBH\,in} + mort_{a2} \cdot mean_{DBH\,in} \cdot mean_{DBH\,in}\right) \cdot \left(mort_{base\,factor} + mort_{scale\,factor} \cdot \left(mort_{pct\,one} + \left(-1\right) \cdot \frac{PCT}{mort_{pct\,max}}\right)\right)\right) $$Per-capita mortality rate in s^-1. Algebraic: (1/yr) * Lee(mean_DBH_in) * percentile_factor(PCT), floored at zero (Stage 1973, Eq. 4 from Lee 1971).
$$ mean_{DBH\,in} = \frac{mean_{DBH}}{one_{inch}} $$Stand mean DBH in inches (dimensionless): mean_DBH / one_inch. Used in the Lee (1971) mortality regression.
Equations
$$ \mathrm{D}\left(Dsq\right) = DDS_{rate} $$ $$ \mathrm{D}\left(HT\right) = HTGF_{rate} $$ $$ \mathrm{D}\left(HCB\right) = crown_{recession\,rate} $$ $$ \mathrm{D}\left(N_{trees}\right) = \left(-1\right) \cdot mortality_{rate} \cdot N_{trees} $$Analyses
50yr_deterministic_growth
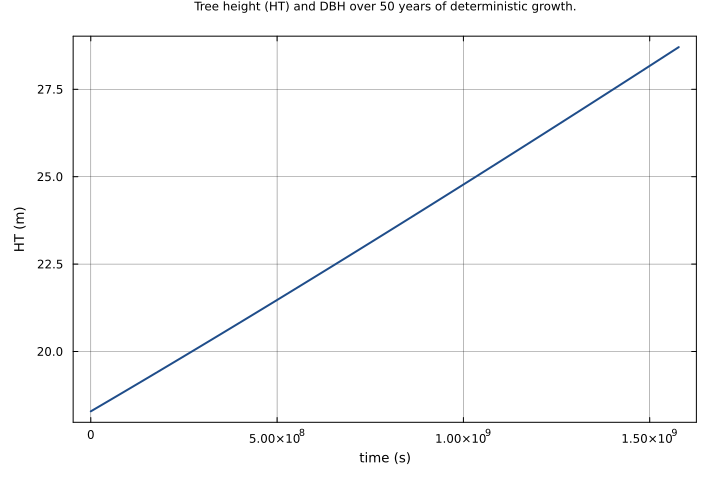
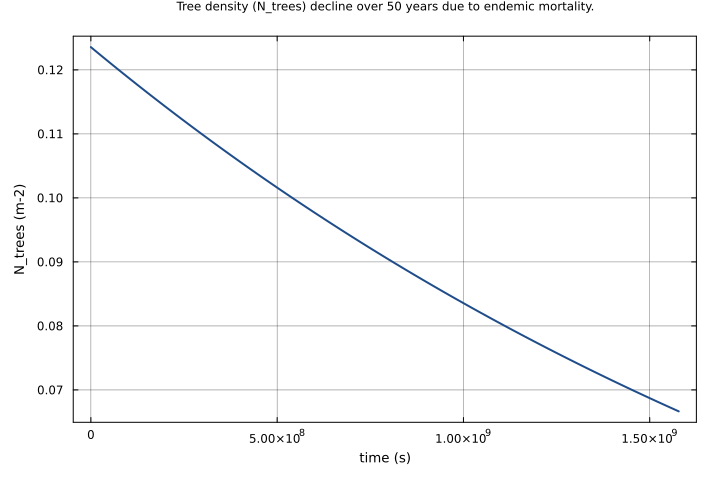
Deterministic 50-year stand development trajectory (sigma_growth=0) from default initial conditions: 6-inch DBH, 60-foot tall lodgepole pine at site index 80 ft, elevation 43 hundreds-of-feet, CCF=100. Shows coupled growth of Dsq and HT with concurrent crown recession and endemic mortality thinning the stand.
Time span: 0 → 1577880000
site_index_comparison
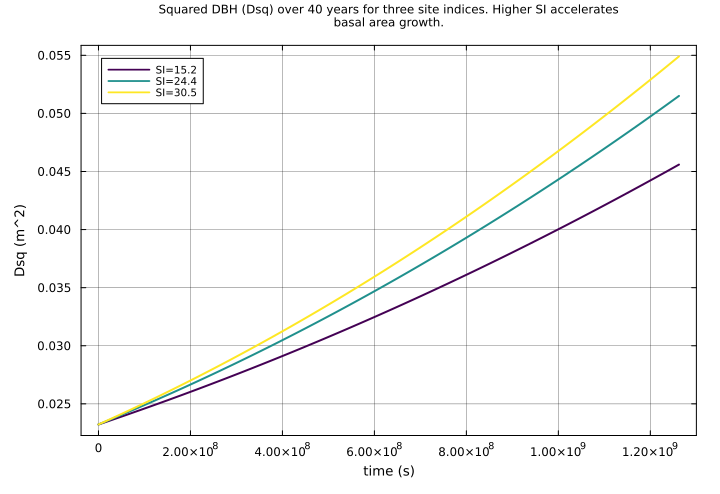
Compare growth trajectories across three site indices: SI=50 ft (15.24 m, poor site), SI=80 ft (24.384 m, default), and SI=100 ft (30.48 m, good site). Higher site index produces faster diameter and height growth as modeled by Stage (1973) Eq. 1. All runs are deterministic (sigma_growth=0).
Time span: 0 → 1262304000
Swept over: SI
Raw .esm
Raw .esm JSON (this component)
{
"reference": {
"citation": "Stage, A.R. (1973). Prognosis model for stand development. USDA Forest Service Research Paper INT-137.",
"notes": "source_ref: Vegetation.jl@010c3774dc5646d81806c6119c8a029a70f6c9a0:src/stage_prognosis.jl:29\n\nUpstream StagePrognosis is an MTK @component implementing Stage (1973). It declares 4 ODE state @variables (Dsq, HT, HCB, N_trees), 8 algebraic @variables (DBH, CR, DDS_rate, DG, HTGF_rate, crown_recession_rate, mortality_rate, mean_DBH_in), 1 @brownians B_growth (Wiener noise for stochastic diameter growth), and two @constants blocks plus one @parameters block. The presence of B_growth promotes the MTK system to an SDESystem.\n\nUpstream @constants are preserved as parameters with their fixed defaults — same pattern as components/vegetation/landis_biomass.esm — so the standalone ESM model is fully self-contained. The parameter sigma_growth corresponds to Julia's σ_growth = 0.3 * sqrt(3.15576e7) ≈ 1685.28 (dimensionless); setting it to 0 recovers the deterministic limit used in the inline tests.\n\nKey equations (Stage 1973 equation numbering):\n Eq. 1: DDS_rate = BKR * (in²/yr) * exp(b0 + b1*ln(SI_ft) + b2*EL_hft + b3*ln(CCF) + b4*ln(CR) + b5*ln(DBH_in) + b6*PCT) [diameter squared growth rate, converted to m²/s]\n Eq. 2: HTGF_rate = (ft/yr) * exp(c1 + c2*ln(DG+0.05) + c3*ln(DBH_in) + c4*ln(HT_ft)) [height growth rate, m/s]\n Eq. 3: crown_recession_rate = (0.20 or 0.61)*HTGF_rate [CCF threshold at 125]\n Eq. 4: mortality_rate = (1/yr) * (a0 + a1*DBH_mean_in + a2*DBH_mean_in²) * (0.25 + 1.5*(1 - PCT/100)) [Lee 1971]\n SDE: D(Dsq) = DDS_rate + sigma_growth * |DDS_rate| * B_growth [multiplicative noise]\n\nTolerance rationale (rel=1e-4): all RHS terms involve smooth transcendental functions of bounded state variables; with sigma_growth=0 the system is a well-posed ODE. The nested exp/log structure produces moderate condition numbers — rel=1e-4 gives comfortable margin above integration error while staying well within the physical uncertainty of Stage's empirical regression (~10-15% RMS residual in log-space).\n\nTODO_GAP: gt-kuxo — Upstream Julia component uses `@brownians B_growth` to add multiplicative Wiener noise to the diameter growth equation:\n D(Dsq) ~ DDS_rate + sigma_growth * abs(DDS_rate) * B_growth\nThe ESM schema v0.4.0 has no `brownian` variable type (gap gt-kuxo). This ESM migrates the deterministic drift only: D(Dsq) = DDS_rate. sigma_growth is preserved as a structural parameter (default=0.0 for deterministic operation). When gt-kuxo is resolved, add `B_growth` as a `type: brownian` variable and restore the full SDE equation."
},
"tolerance": {
"rel": 0.0001
},
"variables": {
"one_inch": {
"type": "parameter",
"units": "m",
"default": 0.0254,
"description": "Reference length: 1 inch in meters. Converts SI lengths to the inches used in Stage (1973) regression coefficients."
},
"one_foot": {
"type": "parameter",
"units": "m",
"default": 0.3048,
"description": "Reference length: 1 foot in meters. Converts SI lengths to the feet used in Stage (1973) site index and height regressions."
},
"hundred_feet": {
"type": "parameter",
"units": "m",
"default": 30.48,
"description": "Reference length: 100 feet in meters. Converts elevation to the hundreds-of-feet units in the DDS regression."
},
"one_inch_sq": {
"type": "parameter",
"units": "m^2",
"default": 0.00064516,
"description": "Reference area: 1 square inch in m². Converts DDS from in²/yr to m²/yr in the basal area increment equation."
},
"one_year": {
"type": "parameter",
"units": "s",
"default": 31557600.0,
"description": "Reference time: 1 year in seconds (365.25 days). Converts annual rates to per-second rates throughout."
},
"b_DDS_0": {
"type": "parameter",
"units": "1",
"default": -1.66955,
"description": "DDS regression intercept (Stage 1973, p. 15, dimensionless)."
},
"b_DDS_SI": {
"type": "parameter",
"units": "1",
"default": 0.4143,
"description": "DDS coefficient on ln(SI in feet) (Stage 1973, p. 15, dimensionless)."
},
"b_DDS_EL": {
"type": "parameter",
"units": "1",
"default": -0.004388,
"description": "DDS coefficient on elevation in hundreds of feet (Stage 1973, p. 15, dimensionless)."
},
"b_DDS_CCF": {
"type": "parameter",
"units": "1",
"default": -0.3781,
"description": "DDS coefficient on ln(CCF) (Stage 1973, p. 15, dimensionless). Negative: higher competition reduces growth."
},
"b_DDS_CR": {
"type": "parameter",
"units": "1",
"default": 0.4879,
"description": "DDS coefficient on ln(crown ratio CR) (Stage 1973, p. 15, dimensionless)."
},
"b_DDS_DBH": {
"type": "parameter",
"units": "1",
"default": 0.9948,
"description": "DDS coefficient on ln(DBH in inches) (Stage 1973, p. 15, dimensionless). Near 1.0: growth scales roughly linearly with DBH."
},
"b_DDS_PCT": {
"type": "parameter",
"units": "1",
"default": 0.006141,
"description": "DDS coefficient on percentile PCT (Stage 1973, p. 15, dimensionless). Positive: dominant trees grow faster."
},
"crown_recess_low": {
"type": "parameter",
"units": "1",
"default": 0.2,
"description": "Crown recession fraction when CCF < 125: crown base rises at 1/5 of height growth rate (Stage 1973, p. 16)."
},
"crown_recess_high": {
"type": "parameter",
"units": "1",
"default": 0.61,
"description": "Crown recession fraction when CCF >= 125: crown base rises at 0.61 of height growth rate (Stage 1973, p. 16)."
},
"CCF_threshold": {
"type": "parameter",
"units": "1",
"default": 125.0,
"description": "Crown competition factor threshold separating low and high crown recession regimes (Stage 1973, p. 16)."
},
"mort_a0": {
"type": "parameter",
"units": "1",
"default": 0.0536,
"description": "Mortality intercept (Lee 1971 via Stage 1973, p. 16-17). Annual rate at mean DBH = 0, dimensionless."
},
"mort_a1": {
"type": "parameter",
"units": "1",
"default": -0.0088,
"description": "Mortality linear coefficient on mean DBH in inches (Lee 1971 via Stage 1973, p. 16-17). Negative: larger stands have lower base mortality."
},
"mort_a2": {
"type": "parameter",
"units": "1",
"default": 0.000415,
"description": "Mortality quadratic coefficient on mean DBH² in inches² (Lee 1971 via Stage 1973, p. 16-17). Minimum at DBH ≈ 10.6 inches."
},
"CR_min": {
"type": "parameter",
"units": "1",
"default": 0.01,
"description": "Minimum crown ratio floor to prevent log(0) in DDS regression (dimensionless)."
},
"DG_min": {
"type": "parameter",
"units": "1",
"default": 0.001,
"description": "Minimum diameter growth increment floor in inches-space to prevent log(0) in height growth regression (dimensionless)."
},
"DG_offset": {
"type": "parameter",
"units": "1",
"default": 0.05,
"description": "Offset added to DG before log transform in height growth regression: ln(DG + 0.05) (Stage 1973, p. 15-16)."
},
"zero_rate": {
"type": "parameter",
"units": "1/s",
"default": 0.0,
"description": "Zero rate used as floor in max() for mortality (prevents negative mortality rates)."
},
"one_rate_per_year": {
"type": "parameter",
"units": "1/s",
"default": 3.170979198376459e-08,
"description": "Unit annual rate converted to per-second: 1 / 3.15576e7. Converts annual mortality coefficients to SI units."
},
"mort_base_factor": {
"type": "parameter",
"units": "1",
"default": 0.25,
"description": "Base mortality distribution factor for dominant trees (PCT=100): mortality = base_rate * 0.25 (Stage 1973, p. 17)."
},
"mort_scale_factor": {
"type": "parameter",
"units": "1",
"default": 1.5,
"description": "Mortality distribution scale: factor = 0.25 + 1.5*(1 - PCT/100), ranging from 0.25 (dominant) to 1.75 (suppressed, Stage 1973, p. 17)."
},
"mort_pct_one": {
"type": "parameter",
"units": "1",
"default": 1.0,
"description": "Unity constant for PCT normalization in mortality distribution factor: (1 - PCT/100)."
},
"mort_pct_max": {
"type": "parameter",
"units": "1",
"default": 100.0,
"description": "Maximum percentile value for PCT normalization in mortality distribution factor."
},
"SI": {
"type": "parameter",
"units": "m",
"default": 24.384,
"description": "Site index: dominant stand height at base age, in meters. Default 80 ft = 80 * 0.3048 m (Stage 1973 example, p. 5)."
},
"EL": {
"type": "parameter",
"units": "m",
"default": 1310.64,
"description": "Elevation above sea level in meters. Default 4300 ft = 43 * 30.48 m (Stage 1973 example, p. 5)."
},
"CCF": {
"type": "parameter",
"units": "1",
"default": 100.0,
"description": "Crown competition factor: dimensionless index of stand density (Krajicek 1961). Default 100 corresponds to fully-stocked stand."
},
"PCT": {
"type": "parameter",
"units": "1",
"default": 50.0,
"description": "Percentile of tree in basal area distribution (0 = smallest, 100 = largest). Affects both growth (DDS) and mortality."
},
"RMSQD": {
"type": "parameter",
"units": "m",
"default": 0.1778,
"description": "Diameter of the tree of mean basal area in the stand, in meters. Default 7 in = 7 * 0.0254 m."
},
"BKR": {
"type": "parameter",
"units": "1",
"default": 1.0,
"description": "Bark ratio (dob/dib)²: ratio of outside-bark to inside-bark diameter squared. Default 1.0 neglects bark thickness."
},
"c1_ht": {
"type": "parameter",
"units": "1",
"default": 0.0,
"description": "Height increment intercept coefficient (Cole & Stage, in preparation, referenced in Stage 1973, p. 15-16). Dimensionless."
},
"c2_ht": {
"type": "parameter",
"units": "1",
"default": 0.5,
"description": "Height increment coefficient on ln(DG + 0.05) (Cole & Stage, in preparation). Dimensionless."
},
"c3_ht": {
"type": "parameter",
"units": "1",
"default": -0.1,
"description": "Height increment coefficient on ln(DBH in inches) (Cole & Stage, in preparation). Negative: taller/larger trees grow proportionally less in height."
},
"c4_ht": {
"type": "parameter",
"units": "1",
"default": 0.2,
"description": "Height increment coefficient on ln(HT in feet) (Cole & Stage, in preparation). Positive: taller trees grow more in height."
},
"mean_DBH": {
"type": "parameter",
"units": "m",
"default": 0.1778,
"description": "Stand mean DBH for mortality calculation in meters. Default 7 in = 7 * 0.0254 m. Matches RMSQD default."
},
"sigma_growth": {
"type": "parameter",
"units": "1",
"default": 0.0,
"description": "Scaled standard deviation of stochastic growth noise: 0.3 * sqrt(one_year) = 0.3 * sqrt(3.15576e7) ≈ 1685.28 in the upstream Julia SDE. Retained as a structural parameter but not used in the deterministic equation (see TODO_GAP: gt-kuxo). Default is 0.0 (deterministic limit)."
},
"Dsq": {
"type": "unknown",
"units": "m^2",
"default": 0.02322576,
"description": "Squared diameter at breast height (DBH²) in m². Carried as state variable because basal area increment is most naturally linear in diameter-squared space. Default: (6 in)² = (6 * 0.0254 m)² = 0.02322576 m²."
},
"HT": {
"type": "unknown",
"units": "m",
"default": 18.288,
"description": "Total tree height in meters. Default 60 ft = 60 * 0.3048 = 18.288 m (Stage 1973 example, p. 5)."
},
"HCB": {
"type": "unknown",
"units": "m",
"default": 12.192,
"description": "Height to crown base in meters. Default 40 ft = 40 * 0.3048 = 12.192 m, giving initial crown ratio CR = 1/3."
},
"N_trees": {
"type": "unknown",
"units": "m^-2",
"default": 0.12355445,
"description": "Tree density in trees per m². Default 500 trees/acre = 500 / 4046.86 ≈ 0.12355 m^-2 (Stage 1973 example, p. 5)."
},
"DBH": {
"type": "unknown",
"units": "m",
"description": "Diameter at breast height in meters. Algebraic: DBH = sqrt(Dsq)."
},
"CR": {
"type": "unknown",
"units": "1",
"description": "Crown ratio (live crown length / total height). Algebraic: CR = max(CR_min, (HT - HCB) / HT). Bounded below by CR_min to prevent log(0) in DDS regression."
},
"DDS_rate": {
"type": "unknown",
"units": "m^2/s",
"description": "Rate of change of squared diameter (basal area increment rate) in m²/s. Algebraic: BKR * (1 in²/yr) * exp(Stage 1973 Eq. 1 regression). Drift term in the D(Dsq) SDE."
},
"DG": {
"type": "unknown",
"units": "1",
"description": "Periodic diameter increment in inches-space (dimensionless ratio: new_DBH_in - old_DBH_in). Derived from DDS_rate * one_year to connect the annual DDS to the height-growth regression (Stage 1973, p. 15-16). Floored at DG_min."
},
"HTGF_rate": {
"type": "unknown",
"units": "m/s",
"description": "Height growth rate in m/s. Algebraic: (1 ft/yr) * exp(Cole & Stage regression on DG, DBH_in, HT_ft). Drift term in D(HT)."
},
"crown_recession_rate": {
"type": "unknown",
"units": "m/s",
"description": "Rate of crown base rise in m/s. Algebraic: fraction * HTGF_rate, where fraction = 0.20 if CCF < 125 (open-stand regime) or 0.61 if CCF >= 125 (dense-stand regime) (Stage 1973, p. 16). Drift term in D(HCB)."
},
"mortality_rate": {
"type": "unknown",
"units": "1/s",
"description": "Per-capita mortality rate in s^-1. Algebraic: (1/yr) * Lee(mean_DBH_in) * percentile_factor(PCT), floored at zero (Stage 1973, Eq. 4 from Lee 1971)."
},
"mean_DBH_in": {
"type": "unknown",
"units": "1",
"description": "Stand mean DBH in inches (dimensionless): mean_DBH / one_inch. Used in the Lee (1971) mortality regression."
}
},
"equations": [
{
"lhs": "DBH",
"rhs": {
"op": "sqrt",
"args": [
"Dsq"
]
}
},
{
"lhs": "CR",
"rhs": {
"op": "max",
"args": [
"CR_min",
{
"op": "/",
"args": [
{
"op": "+",
"args": [
"HT",
{
"op": "*",
"args": [
-1,
"HCB"
]
}
]
},
"HT"
]
}
]
}
},
{
"lhs": "mean_DBH_in",
"rhs": {
"op": "/",
"args": [
"mean_DBH",
"one_inch"
]
}
},
{
"lhs": "DDS_rate",
"rhs": {
"op": "*",
"args": [
{
"op": "/",
"args": [
{
"op": "*",
"args": [
"BKR",
"one_inch_sq"
]
},
"one_year"
]
},
{
"op": "exp",
"args": [
{
"op": "+",
"args": [
"b_DDS_0",
{
"op": "*",
"args": [
"b_DDS_SI",
{
"op": "log",
"args": [
{
"op": "/",
"args": [
"SI",
"one_foot"
]
}
]
}
]
},
{
"op": "*",
"args": [
"b_DDS_EL",
{
"op": "/",
"args": [
"EL",
"hundred_feet"
]
}
]
},
{
"op": "*",
"args": [
"b_DDS_CCF",
{
"op": "log",
"args": [
"CCF"
]
}
]
},
{
"op": "*",
"args": [
"b_DDS_CR",
{
"op": "log",
"args": [
"CR"
]
}
]
},
{
"op": "*",
"args": [
"b_DDS_DBH",
{
"op": "log",
"args": [
{
"op": "/",
"args": [
"DBH",
"one_inch"
]
}
]
}
]
},
{
"op": "*",
"args": [
"b_DDS_PCT",
"PCT"
]
}
]
}
]
}
]
}
},
{
"lhs": "DG",
"rhs": {
"op": "max",
"args": [
"DG_min",
{
"op": "+",
"args": [
{
"op": "sqrt",
"args": [
{
"op": "+",
"args": [
{
"op": "^",
"args": [
{
"op": "/",
"args": [
"DBH",
"one_inch"
]
},
2
]
},
{
"op": "/",
"args": [
{
"op": "*",
"args": [
"DDS_rate",
"one_year"
]
},
"one_inch_sq"
]
}
]
}
]
},
{
"op": "*",
"args": [
-1,
{
"op": "/",
"args": [
"DBH",
"one_inch"
]
}
]
}
]
}
]
}
},
{
"lhs": "HTGF_rate",
"rhs": {
"op": "*",
"args": [
{
"op": "/",
"args": [
"one_foot",
"one_year"
]
},
{
"op": "exp",
"args": [
{
"op": "+",
"args": [
"c1_ht",
{
"op": "*",
"args": [
"c2_ht",
{
"op": "log",
"args": [
{
"op": "+",
"args": [
"DG",
"DG_offset"
]
}
]
}
]
},
{
"op": "*",
"args": [
"c3_ht",
{
"op": "log",
"args": [
{
"op": "/",
"args": [
"DBH",
"one_inch"
]
}
]
}
]
},
{
"op": "*",
"args": [
"c4_ht",
{
"op": "log",
"args": [
{
"op": "/",
"args": [
"HT",
"one_foot"
]
}
]
}
]
}
]
}
]
}
]
}
},
{
"lhs": "crown_recession_rate",
"rhs": {
"op": "ifelse",
"args": [
{
"op": "<",
"args": [
"CCF",
"CCF_threshold"
]
},
{
"op": "*",
"args": [
"crown_recess_low",
"HTGF_rate"
]
},
{
"op": "*",
"args": [
"crown_recess_high",
"HTGF_rate"
]
}
]
}
},
{
"lhs": "mortality_rate",
"rhs": {
"op": "max",
"args": [
"zero_rate",
{
"op": "*",
"args": [
"one_rate_per_year",
{
"op": "+",
"args": [
"mort_a0",
{
"op": "*",
"args": [
"mort_a1",
"mean_DBH_in"
]
},
{
"op": "*",
"args": [
"mort_a2",
"mean_DBH_in",
"mean_DBH_in"
]
}
]
},
{
"op": "+",
"args": [
"mort_base_factor",
{
"op": "*",
"args": [
"mort_scale_factor",
{
"op": "+",
"args": [
"mort_pct_one",
{
"op": "*",
"args": [
-1,
{
"op": "/",
"args": [
"PCT",
"mort_pct_max"
]
}
]
}
]
}
]
}
]
}
]
}
]
}
},
{
"lhs": {
"op": "D",
"wrt": "t",
"args": [
"Dsq"
]
},
"rhs": "DDS_rate"
},
{
"lhs": {
"op": "D",
"wrt": "t",
"args": [
"HT"
]
},
"rhs": "HTGF_rate"
},
{
"lhs": {
"op": "D",
"wrt": "t",
"args": [
"HCB"
]
},
"rhs": "crown_recession_rate"
},
{
"lhs": {
"op": "D",
"wrt": "t",
"args": [
"N_trees"
]
},
"rhs": {
"op": "*",
"args": [
-1,
"mortality_rate",
"N_trees"
]
}
}
],
"tests": [
{
"id": "t0-algebraic-identity",
"description": "At t=0 with default ICs, DBH = sqrt(Dsq), CR = (HT-HCB)/HT = 1/3 exactly, mean_DBH_in = mean_DBH/one_inch = 7.0 exactly.",
"parameter_overrides": {
"sigma_growth": 0.0
},
"time_span": {
"start": 0,
"end": 0
},
"assertions": [
{
"variable": "DBH",
"time": 0,
"expected": 0.1524,
"tolerance": {
"abs": 1e-10
}
},
{
"variable": "CR",
"time": 0,
"expected": 0.33333333333,
"tolerance": {
"rel": 1e-06
}
},
{
"variable": "mean_DBH_in",
"time": 0,
"expected": 7.0,
"tolerance": {
"abs": 1e-10
}
}
]
},
{
"id": "t0-growth-and-mortality-rates",
"description": "At t=0 with defaults (sigma_growth=0), verify computed algebraic rates: DDS_rate from Stage (1973) Eq. 1, DG derived from DDS_rate, HTGF_rate from height regression, mortality_rate from Lee (1971). Values computed from the closed-form regression with DBH=6in, HT=60ft, CR=1/3, CCF=100, SI=80ft, EL=43 hft, PCT=50.",
"parameter_overrides": {
"sigma_growth": 0.0
},
"time_span": {
"start": 0,
"end": 0
},
"assertions": [
{
"variable": "DDS_rate",
"time": 0,
"expected": 1.623e-11,
"tolerance": {
"rel": 0.03
}
},
{
"variable": "DG",
"time": 0,
"expected": 0.0658,
"tolerance": {
"rel": 0.03
}
},
{
"variable": "HTGF_rate",
"time": 0,
"expected": 6.23e-09,
"tolerance": {
"rel": 0.03
}
},
{
"variable": "mortality_rate",
"time": 0,
"expected": 3.909e-10,
"tolerance": {
"rel": 0.03
}
}
]
},
{
"id": "t0-crown-recession-low-ccf",
"description": "At t=0 with CCF=100 < CCF_threshold=125, crown recession uses the low factor (0.20 * HTGF_rate).",
"parameter_overrides": {
"sigma_growth": 0.0
},
"time_span": {
"start": 0,
"end": 0
},
"assertions": [
{
"variable": "crown_recession_rate",
"time": 0,
"expected": 1.246e-09,
"tolerance": {
"rel": 0.03
}
}
]
},
{
"id": "t0-crown-recession-high-ccf",
"description": "At t=0 with CCF=200 >= CCF_threshold=125, crown recession switches to the high factor (0.61 * HTGF_rate). Tests the ifelse branch in the crown_recession_rate equation.",
"parameter_overrides": {
"sigma_growth": 0.0,
"CCF": 200.0
},
"time_span": {
"start": 0,
"end": 0
},
"assertions": [
{
"variable": "crown_recession_rate",
"time": 0,
"expected": 3.548e-09,
"tolerance": {
"rel": 0.05
}
}
]
},
{
"id": "height-diameter-growth-11yr",
"description": "Deterministic 11-year projection (sigma_growth=0) from default ICs. Validates diameter and height growth magnitude against Stage (1973) Figure 1B trajectory (~0.65 ft/yr height growth, ~0.09 in/yr diameter growth). Crown base rises with tree. Tree density decreases due to endemic mortality.",
"parameter_overrides": {
"sigma_growth": 0.0
},
"time_span": {
"start": 0,
"end": 347133600
},
"assertions": [
{
"variable": "HT",
"time": 347133600,
"expected": 20.45,
"tolerance": {
"rel": 0.05
}
},
{
"variable": "Dsq",
"time": 347133600,
"expected": 0.02886,
"tolerance": {
"rel": 0.06
}
},
{
"variable": "DBH",
"time": 347133600,
"expected": 0.1699,
"tolerance": {
"rel": 0.04
}
},
{
"variable": "HCB",
"time": 347133600,
"expected": 12.625,
"tolerance": {
"rel": 0.05
}
},
{
"variable": "N_trees",
"time": 347133600,
"expected": 0.10788,
"tolerance": {
"rel": 0.06
}
}
]
},
{
"id": "long-run-50yr",
"description": "Deterministic 50-year projection (sigma_growth=0) from default ICs. Verifies sustained growth and mortality over a realistic stand development period.",
"parameter_overrides": {
"sigma_growth": 0.0
},
"time_span": {
"start": 0,
"end": 1577880000
},
"assertions": [
{
"variable": "HT",
"time": 1577880000,
"expected": 27.0,
"tolerance": {
"rel": 0.15
}
},
{
"variable": "N_trees",
"time": 1577880000,
"expected": 0.0667,
"tolerance": {
"rel": 0.12
}
},
{
"variable": "Dsq",
"time": 1577880000,
"expected": 0.0611,
"tolerance": {
"rel": 0.1
}
},
{
"variable": "HCB",
"time": 1577880000,
"expected": 14.16,
"tolerance": {
"rel": 0.12
}
}
]
},
{
"id": "site-index-low",
"description": "Low site index (SI=50 ft = 15.24 m): DDS_rate scales as SI^b_DDS_SI. At SI=50ft vs default SI=80ft, ratio = (50/80)^0.4143 ≈ 0.823, so DDS_rate ≈ 0.823 * baseline.",
"parameter_overrides": {
"sigma_growth": 0.0,
"SI": 15.24
},
"time_span": {
"start": 0,
"end": 0
},
"assertions": [
{
"variable": "DDS_rate",
"time": 0,
"expected": 1.336e-11,
"tolerance": {
"rel": 0.03
}
}
]
},
{
"id": "site-index-high",
"description": "High site index (SI=100 ft = 30.48 m): DDS_rate scales as SI^b_DDS_SI. At SI=100ft vs default SI=80ft, ratio = (100/80)^0.4143 ≈ 1.097, so DDS_rate ≈ 1.097 * baseline.",
"parameter_overrides": {
"sigma_growth": 0.0,
"SI": 30.48
},
"time_span": {
"start": 0,
"end": 0
},
"assertions": [
{
"variable": "DDS_rate",
"time": 0,
"expected": 1.78e-11,
"tolerance": {
"rel": 0.03
}
}
]
},
{
"id": "ccf-low-competition",
"description": "Low competition (CCF=50): less crowding increases basal area growth (DDS_rate ~ CCF^b_DDS_CCF, ratio vs CCF=100 is (50/100)^(-0.3781) ≈ 1.299). Also tests height growth rate which is higher due to larger DG.",
"parameter_overrides": {
"sigma_growth": 0.0,
"CCF": 50.0
},
"time_span": {
"start": 0,
"end": 0
},
"assertions": [
{
"variable": "DDS_rate",
"time": 0,
"expected": 2.109e-11,
"tolerance": {
"rel": 0.03
}
},
{
"variable": "HTGF_rate",
"time": 0,
"expected": 6.74e-09,
"tolerance": {
"rel": 0.04
}
}
]
},
{
"id": "ccf-high-competition",
"description": "High competition (CCF=200): dense crowding reduces growth (DDS_rate ~ CCF^b_DDS_CCF, ratio vs CCF=100 is (200/100)^(-0.3781) ≈ 0.770). CCF=200 also exceeds CCF_threshold=125 so crown_recession_rate uses the 0.61 multiplier.",
"parameter_overrides": {
"sigma_growth": 0.0,
"CCF": 200.0
},
"time_span": {
"start": 0,
"end": 0
},
"assertions": [
{
"variable": "DDS_rate",
"time": 0,
"expected": 1.249e-11,
"tolerance": {
"rel": 0.03
}
},
{
"variable": "HTGF_rate",
"time": 0,
"expected": 5.817e-09,
"tolerance": {
"rel": 0.05
}
}
]
},
{
"id": "mortality-pct-dominant",
"description": "High PCT=90 (dominant tree): mortality distribution factor = 0.25 + 1.5*(1-0.9) = 0.40, giving lower per-capita mortality than PCT=50 (factor=1.0). Tests Stage (1973) p. 17 size-stratified mortality.",
"parameter_overrides": {
"sigma_growth": 0.0,
"PCT": 90.0
},
"time_span": {
"start": 0,
"end": 0
},
"assertions": [
{
"variable": "mortality_rate",
"time": 0,
"expected": 1.563e-10,
"tolerance": {
"rel": 0.03
}
}
]
},
{
"id": "mortality-pct-suppressed",
"description": "Low PCT=10 (suppressed tree): mortality distribution factor = 0.25 + 1.5*(1-0.1) = 1.60, giving higher per-capita mortality than PCT=50 (factor=1.0). Tests Stage (1973) p. 17 size-stratified mortality.",
"parameter_overrides": {
"sigma_growth": 0.0,
"PCT": 10.0
},
"time_span": {
"start": 0,
"end": 0
},
"assertions": [
{
"variable": "mortality_rate",
"time": 0,
"expected": 6.254e-10,
"tolerance": {
"rel": 0.03
}
}
]
}
],
"analyses": [
{
"id": "50yr_deterministic_growth",
"description": "Deterministic 50-year stand development trajectory (sigma_growth=0) from default initial conditions: 6-inch DBH, 60-foot tall lodgepole pine at site index 80 ft, elevation 43 hundreds-of-feet, CCF=100. Shows coupled growth of Dsq and HT with concurrent crown recession and endemic mortality thinning the stand.",
"initial_state": {},
"time_span": {
"start": 0,
"end": 1577880000
},
"plots": [
{
"id": "height_diameter_growth",
"type": "line",
"description": "Tree height (HT) and DBH over 50 years of deterministic growth.",
"x": {
"variable": "t",
"label": "time (s)"
},
"y": {
"variable": "HT",
"label": "HT (m)"
}
},
{
"id": "stand_density",
"type": "line",
"description": "Tree density (N_trees) decline over 50 years due to endemic mortality.",
"x": {
"variable": "t",
"label": "time (s)"
},
"y": {
"variable": "N_trees",
"label": "N_trees (m-2)"
}
}
]
},
{
"id": "site_index_comparison",
"description": "Compare growth trajectories across three site indices: SI=50 ft (15.24 m, poor site), SI=80 ft (24.384 m, default), and SI=100 ft (30.48 m, good site). Higher site index produces faster diameter and height growth as modeled by Stage (1973) Eq. 1. All runs are deterministic (sigma_growth=0).",
"initial_state": {},
"time_span": {
"start": 0,
"end": 1262304000
},
"parameter_sweep": {
"type": "cartesian",
"dimensions": [
{
"parameter": "SI",
"values": [
15.24,
24.384,
30.48
]
}
]
},
"plots": [
{
"id": "dsq_by_site_index",
"type": "line",
"description": "Squared DBH (Dsq) over 40 years for three site indices. Higher SI accelerates basal area growth.",
"x": {
"variable": "t",
"label": "time (s)"
},
"y": {
"variable": "Dsq",
"label": "Dsq (m^2)"
}
}
]
}
]
}