LANDISBiomass
LANDIS forest growth and biomass module for a single species-age cohort. Tracks aboveground living biomass B and dead woody biomass D_wood under three coupled processes: growth (peaked ANPP function of B_AP = B/B_POT), mortality (logistic biomass-dependent M_BIO + exponential age-dependent M_AGE), and decomposition (M_total - k·D_wood). Migrated from Vegetation.jl src/landis_biomass.jl:28. All quantities in SI base units (kg/m^2 for biomass, seconds for time); upstream paper uses Mg/ha and years (1 Mg/ha = 0.1 kg/m^2, 1 yr = 3.15576e7 s).
Description
LANDIS forest growth and biomass module for a single species-age cohort. Tracks aboveground living biomass B and dead woody biomass D_wood under three coupled processes: growth (peaked ANPP function of B_AP = B/B_POT), mortality (logistic biomass-dependent M_BIO + exponential age-dependent M_AGE), and decomposition (M_total - k·D_wood). Migrated from Vegetation.jl src/landis_biomass.jl:28. All quantities in SI base units (kg/m^2 for biomass, seconds for time); upstream paper uses Mg/ha and years (1 Mg/ha = 0.1 kg/m^2, 1 yr = 3.15576e7 s).
Reference
Scheller, R.M. and Mladenoff, D.J. (2004). A forest growth and biomass module for a landscape simulation model, LANDIS: design, validation, and application. Ecological Modelling, 180, 211-229.
_source_ref: Vegetation.jl@573a3733ee575c6e28f73c9c02ee419e07fb839c:src/landis_biomass.jl:28 Upstream LANDISBiomass is an MTK @component implementing the Scheller & Mladenoff (2004) biomass module for a single species-age cohort. The component declares 2 state @variables (B, D_wood), 9 algebraic @variables (cohort_age, B_MAX, B_POT, B_AP, B_PM, ANPP_ACT, M_BIO, M_AGE, M_total), 9 @parameters (ANPP_MAX, max_age, r, y0, d, k, B_MAX_site, B_other, age_init), and 3 @constants (e1=exp(1), B_MAX_ratio=30·yr_to_s, one_yr=yr_to_s). The 3 upstream @constants are preserved here as parameters with the upstream defaults — same pattern as components/wildland_fire/level_set/fire_heat_flux.esm — so the standalone ESM model is well-posed without external coupling.
The 11 source equations are preserved as follows:
- D(cohort_age)/dt = 1 with cohort_age(0) = age_init (Eq. 1: cohort_age = age_init + t, expressed as an ODE because the ESS Python runner only plumbs the independent variable t through observed-expression bodies, not algebraic/differential RHS — cohort_age is a tracked state with trivial dynamics so M_AGE’s downstream algebraic reference to it stays well-defined)
- B_MAX = ANPP_MAX · B_MAX_ratio (Eq. 2)
- B_POT = max(B, min(B_MAX, B_MAX_site - B_other)) (Eq. 3 — available growing space)
- B_AP = B / B_POT (Eq. 4 auxiliary, ratio of actual to potential)
- B_PM = B_POT / B_MAX (Eq. 4 auxiliary, ratio of potential to maximum)
- ANPP_ACT = ANPP_MAX · e1 · B_AP · exp(-B_AP) · B_PM (Eq. 4 — peaked growth)
- M_BIO = ANPP_MAX · y0 / (y0 + (1-y0)·exp(-r/y0·B_AP)) · B_PM (Eq. 5 — logistic biomass mortality)
- M_AGE = (B/one_yr) · exp((cohort_age/max_age)·d) / exp(d) (Eq. 6 — exponential age mortality)
- M_total = M_BIO + M_AGE
- D(B) = ANPP_ACT - M_total (Eq. 1, upstream)
- D(D_wood) = M_total - k·D_wood (Eq. 7)
TODO_GAP: gt-p3ep - non-standard op ‘max’ likely requires a registered function declaration — see gt-p3ep @ equations[5].rhs TODO_GAP: gt-p3ep - non-standard op ‘min’ likely requires a registered function declaration — see gt-p3ep @ equations[5].rhs (Note: max/min are in the v0.4.0 schema’s op enum, so the gt-p3ep marker is informational here — same pattern as components/wildland_fire/nfdrs/lightning_fire_occurrence.esm and woody_moisture.esm, which also use min/max ops directly. The migration tracker records blocking_gap=none.)
Tolerance rationale (model-level rel=1e-6): the equation set is a 3-state ODE (B, D_wood, cohort_age) with smooth, well-behaved RHS over the realistic age range (cohort_age < max_age); the age-related mortality term exp(d·cohort_age/max_age) grows exponentially past max_age, making the system effectively stiff at the end of a species’ lifespan. The cohort_age channel has trivial D(cohort_age)/dt=1 dynamics and adds no integrator stiffness. Tsit5 with reltol=1e-10/abstol=1e-12 (the walker defaults) gives sub-1e-9 truncation across the 0-200 yr tests against the analytical algebraic checks; rel=1e-6 is comfortably above this and below the ~1% range cited for biomass measurements in Scheller & Mladenoff (2004). Tests use the model-level default throughout._
- DOI: 10.1016/j.ecolmodel.2004.01.022
Variables
| Name | Units | Default | Description |
|---|---|---|---|
B | kg/m^2 | 0.5 | Aboveground living biomass of the cohort. Default 5 Mg/ha = 0.5 kg/m^2 — a viable initial value for net positive growth under default parameters. |
D_wood | kg/m^2 | 0.0 | Dead woody biomass. Accumulates from cohort mortality, decays at rate k. |
cohort_age | s | 315576000.0 | Cohort age. Mathematically cohort_age(t) = age_init + t (Eq. 1, drives the M_AGE term in Eq. 6). Carried as a differential state with D(cohort_age)/dt = 1 and initial value = age_init, because the ESS Python runner only plumbs the independent variable t through observed-expression bodies (not algebraic/differential RHS); promoting cohort_age to a tracked state is the standard MTK→ESS workaround. Default 10 years in seconds matches age_init’s default — tests that override age_init must also supply cohort_age via initial_conditions to keep the system consistent. |
Parameters
| Name | Units | Default | Description |
|---|---|---|---|
e1 | 1 | 2.718281828459045 | Euler’s number (preserved from upstream MTK @constants for unit-balancing of the peaked-growth coefficient in Eq. 4). |
B_MAX_ratio | s | 946728000.0 | Ratio of maximum biomass to maximum ANPP (Eq. 2). 30 years in seconds (30 * 3.15576e7). |
one_yr | s | 31557600.0 | One year in seconds, used to convert annual biomass rates into per-second rates in Eq. 6. |
ANPP_MAX | kg/m^2/s | 2.360762542145157e-08 | Maximum aboveground net primary productivity for the species. Default is A. saccharum (7.45 Mg/ha/yr) converted to SI: 7.45 * 0.1 / 3.15576e7. |
max_age | s | 12623040000.0 | Maximum species longevity (sets the age scale for M_AGE). Default is A. saccharum (400 years) in seconds: 400 * 3.15576e7. |
r | 1 | 0.08 | Mortality rate growth parameter (Scheller & Mladenoff 2004, Eq. 5). Dimensionless. |
y0 | 1 | 0.01 | Initial mortality rate, rescaled to [0,1] (Scheller & Mladenoff 2004, Eq. 5). Dimensionless. |
d | 1 | 10.0 | Age-related mortality shape parameter (Scheller & Mladenoff 2004, Eq. 6). Dimensionless. |
k | 1/s | 9.506426344208685e-10 | Dead biomass decomposition rate (Scheller & Mladenoff 2004, Eq. 7). Default 0.03/yr converted to s^-1: 0.03 / 3.15576e7. |
B_MAX_site | kg/m^2 | 50.0 | Maximum site biomass over all cohorts. Default 500 Mg/ha = 50 kg/m^2 (Scheller & Mladenoff 2004 Table 1). |
B_other | kg/m^2 | 0.0 | Biomass of all other cohorts at the site (competition term in Eq. 3). When coupled with other cohorts in a multi-cohort site this is driven externally; for the standalone single-cohort model it defaults to zero. |
age_init | s | 315576000.0 | Initial cohort age (Eq. 1 for cohort_age). Default 10 years in seconds: 10 * 3.15576e7. |
Observed
| Name | Units | Default | Description |
|---|---|---|---|
B_MAX | kg/m^2 | Maximum possible biomass for the species (Eq. 2). Constant in time at ANPP_MAX * B_MAX_ratio. | |
B_POT | kg/m^2 | Potential biomass, the available growing space (Eq. 3): max(B, min(B_MAX, B_MAX_site - B_other)). | |
B_AP | 1 | Ratio of actual to potential biomass, B / B_POT (Eq. 4 auxiliary). Dimensionless. Drives the peaked growth and logistic mortality. | |
B_PM | 1 | Ratio of potential to maximum biomass, B_POT / B_MAX (Eq. 4 auxiliary). Dimensionless. Damps growth and mortality under competition. | |
ANPP_ACT | kg/m^2/s | Actual ANPP (Eq. 4). Peaked function of B_AP that maxes at B_AP=1, B_PM=1 with value ANPP_MAX. | |
M_BIO | kg/m^2/s | Biomass-related mortality rate (Eq. 5). Logistic in B_AP, scaled by B_PM. | |
M_AGE | kg/m^2/s | Age-related mortality rate (Eq. 6). Exponential in cohort_age, drives senescence as cohort_age approaches max_age. | |
M_total | kg/m^2/s | Total mortality rate, M_BIO + M_AGE. |
Observed expressions
$$ B_{MAX} = ANPP_{MAX} \cdot B_{MAX\,ratio} $$Maximum possible biomass for the species (Eq. 2). Constant in time at ANPP_MAX * B_MAX_ratio.
$$ B_{POT} = \mathrm{max}\left(B, \mathrm{min}\left(B_{MAX}, B_{MAX\,site} + \left(-1\right) \cdot B_{other}\right)\right) $$Potential biomass, the available growing space (Eq. 3): max(B, min(B_MAX, B_MAX_site - B_other)).
$$ B_{AP} = \frac{B}{B_{POT}} $$Ratio of actual to potential biomass, B / B_POT (Eq. 4 auxiliary). Dimensionless. Drives the peaked growth and logistic mortality.
$$ B_{PM} = \frac{B_{POT}}{B_{MAX}} $$Ratio of potential to maximum biomass, B_POT / B_MAX (Eq. 4 auxiliary). Dimensionless. Damps growth and mortality under competition.
$$ ANPP_{ACT} = ANPP_{MAX} \cdot e1 \cdot B_{AP} \cdot e^{\left(-1\right) \cdot B_{AP}} \cdot B_{PM} $$Actual ANPP (Eq. 4). Peaked function of B_AP that maxes at B_AP=1, B_PM=1 with value ANPP_MAX.
$$ M_{BIO} = ANPP_{MAX} \cdot \frac{y0}{y0 + \left(1 + \left(-1\right) \cdot y0\right) \cdot e^{\left(-1\right) \cdot \frac{r}{y0} \cdot B_{AP}}} \cdot B_{PM} $$Biomass-related mortality rate (Eq. 5). Logistic in B_AP, scaled by B_PM.
$$ M_{AGE} = \frac{\frac{B}{one_{yr}} \cdot e^{\frac{cohort_{age}}{max_{age}} \cdot d}}{e^{d}} $$Age-related mortality rate (Eq. 6). Exponential in cohort_age, drives senescence as cohort_age approaches max_age.
$$ M_{total} = M_{BIO} + M_{AGE} $$Total mortality rate, M_BIO + M_AGE.
Equations
$$ \mathrm{D}\left(cohort_{age}\right) = 1 $$ $$ \mathrm{D}\left(B\right) = ANPP_{ACT} + \left(-1\right) \cdot M_{total} $$ $$ \mathrm{D}\left(D_{wood}\right) = M_{total} + \left(-1\right) \cdot k \cdot D_{wood} $$Analyses
a_saccharum_200yr_default
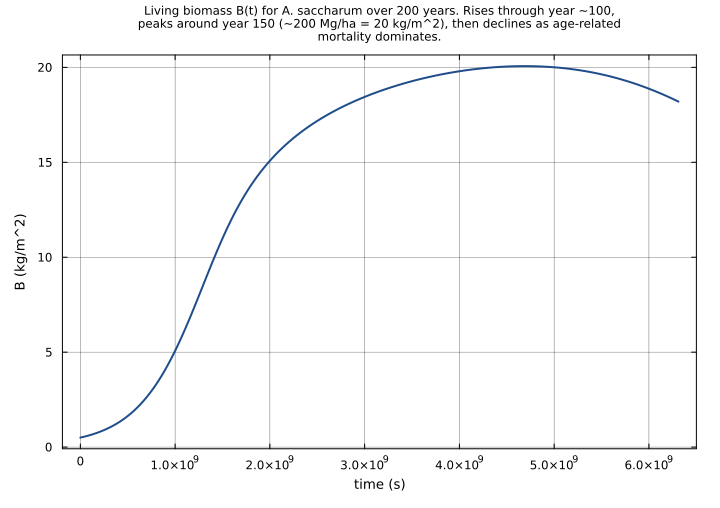
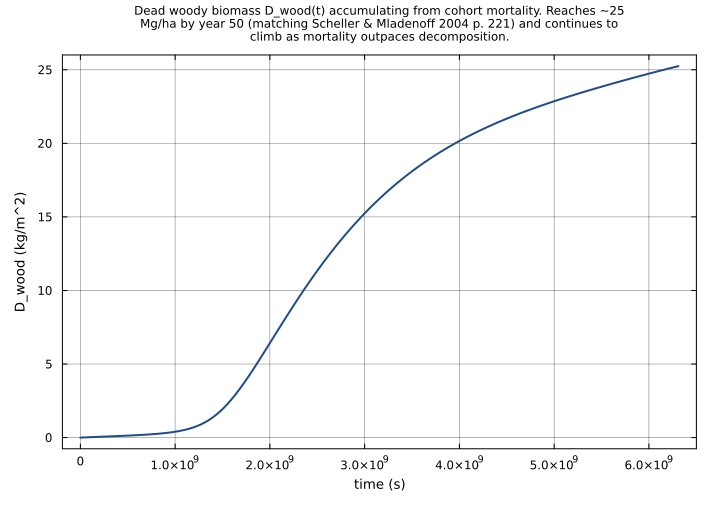
Scheller & Mladenoff (2004) Fig. 6a reproduction — A. saccharum baseline 200-year run with default parameters (ANPP_MAX=7.45 Mg/ha/yr, max_age=400 yr, B(0)=5 Mg/ha). Plots living biomass B(t) and dead woody biomass D_wood(t) over time, showing the characteristic rise to a peak around year ~150 and the steady accumulation of D_wood.
Time span: 0.0 → 6311520000.0
species_longevity_sweep
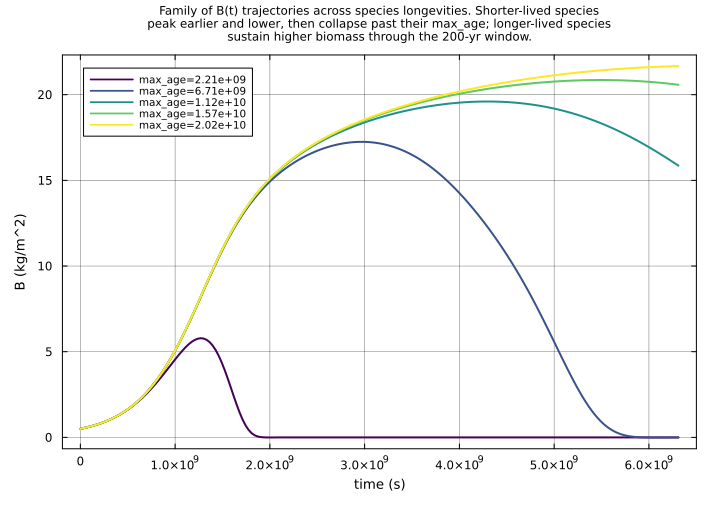
Sweep max_age over typical Scheller & Mladenoff (2004) Table 2 species values (70 yr P. banksiana, 120 yr P. tremuloides, 200 yr B. papyrifera, 400 yr A. saccharum, 640 yr T. canadensis). Surfaces the qualitative effect of species longevity on peak timing and the late-time collapse driven by exp((cohort_age/max_age)*d).
Time span: 0.0 → 6311520000.0
Swept over: max_age
Raw .esm
Raw .esm JSON (this component)
{
"reference": {
"doi": "10.1016/j.ecolmodel.2004.01.022",
"citation": "Scheller, R.M. and Mladenoff, D.J. (2004). A forest growth and biomass module for a landscape simulation model, LANDIS: design, validation, and application. Ecological Modelling, 180, 211-229.",
"notes": "source_ref: Vegetation.jl@573a3733ee575c6e28f73c9c02ee419e07fb839c:src/landis_biomass.jl:28\nUpstream LANDISBiomass is an MTK @component implementing the Scheller & Mladenoff (2004) biomass module for a single species-age cohort. The component declares 2 state @variables (B, D_wood), 9 algebraic @variables (cohort_age, B_MAX, B_POT, B_AP, B_PM, ANPP_ACT, M_BIO, M_AGE, M_total), 9 @parameters (ANPP_MAX, max_age, r, y0, d, k, B_MAX_site, B_other, age_init), and 3 @constants (e1=exp(1), B_MAX_ratio=30·yr_to_s, one_yr=yr_to_s). The 3 upstream @constants are preserved here as parameters with the upstream defaults — same pattern as components/wildland_fire/level_set/fire_heat_flux.esm — so the standalone ESM model is well-posed without external coupling.\n\nThe 11 source equations are preserved as follows:\n 1. D(cohort_age)/dt = 1 with cohort_age(0) = age_init (Eq. 1: cohort_age = age_init + t, expressed as an ODE because the ESS Python runner only plumbs the independent variable t through observed-expression bodies, not algebraic/differential RHS — cohort_age is a tracked state with trivial dynamics so M_AGE's downstream algebraic reference to it stays well-defined)\n 2. B_MAX = ANPP_MAX · B_MAX_ratio (Eq. 2)\n 3. B_POT = max(B, min(B_MAX, B_MAX_site - B_other)) (Eq. 3 — available growing space)\n 4. B_AP = B / B_POT (Eq. 4 auxiliary, ratio of actual to potential)\n 5. B_PM = B_POT / B_MAX (Eq. 4 auxiliary, ratio of potential to maximum)\n 6. ANPP_ACT = ANPP_MAX · e1 · B_AP · exp(-B_AP) · B_PM (Eq. 4 — peaked growth)\n 7. M_BIO = ANPP_MAX · y0 / (y0 + (1-y0)·exp(-r/y0·B_AP)) · B_PM (Eq. 5 — logistic biomass mortality)\n 8. M_AGE = (B/one_yr) · exp((cohort_age/max_age)·d) / exp(d) (Eq. 6 — exponential age mortality)\n 9. M_total = M_BIO + M_AGE\n 10. D(B) = ANPP_ACT - M_total (Eq. 1, upstream)\n 11. D(D_wood) = M_total - k·D_wood (Eq. 7)\n\nTODO_GAP: gt-p3ep - non-standard op 'max' likely requires a registered function declaration — see gt-p3ep @ equations[5].rhs\nTODO_GAP: gt-p3ep - non-standard op 'min' likely requires a registered function declaration — see gt-p3ep @ equations[5].rhs\n(Note: max/min are in the v0.4.0 schema's op enum, so the gt-p3ep marker is informational here — same pattern as components/wildland_fire/nfdrs/lightning_fire_occurrence.esm and woody_moisture.esm, which also use min/max ops directly. The migration tracker records blocking_gap=none.)\n\nTolerance rationale (model-level rel=1e-6): the equation set is a 3-state ODE (B, D_wood, cohort_age) with smooth, well-behaved RHS over the realistic age range (cohort_age < max_age); the age-related mortality term exp(d·cohort_age/max_age) grows exponentially past max_age, making the system effectively stiff at the end of a species' lifespan. The cohort_age channel has trivial D(cohort_age)/dt=1 dynamics and adds no integrator stiffness. Tsit5 with reltol=1e-10/abstol=1e-12 (the walker defaults) gives sub-1e-9 truncation across the 0-200 yr tests against the analytical algebraic checks; rel=1e-6 is comfortably above this and below the ~1% range cited for biomass measurements in Scheller & Mladenoff (2004). Tests use the model-level default throughout."
},
"tolerance": {
"rel": 1e-06
},
"variables": {
"e1": {
"type": "parameter",
"units": "1",
"default": 2.718281828459045,
"description": "Euler's number (preserved from upstream MTK @constants for unit-balancing of the peaked-growth coefficient in Eq. 4)."
},
"B_MAX_ratio": {
"type": "parameter",
"units": "s",
"default": 946728000.0,
"description": "Ratio of maximum biomass to maximum ANPP (Eq. 2). 30 years in seconds (30 * 3.15576e7)."
},
"one_yr": {
"type": "parameter",
"units": "s",
"default": 31557600.0,
"description": "One year in seconds, used to convert annual biomass rates into per-second rates in Eq. 6."
},
"ANPP_MAX": {
"type": "parameter",
"units": "kg/m^2/s",
"default": 2.360762542145157e-08,
"description": "Maximum aboveground net primary productivity for the species. Default is A. saccharum (7.45 Mg/ha/yr) converted to SI: 7.45 * 0.1 / 3.15576e7."
},
"max_age": {
"type": "parameter",
"units": "s",
"default": 12623040000.0,
"description": "Maximum species longevity (sets the age scale for M_AGE). Default is A. saccharum (400 years) in seconds: 400 * 3.15576e7."
},
"r": {
"type": "parameter",
"units": "1",
"default": 0.08,
"description": "Mortality rate growth parameter (Scheller & Mladenoff 2004, Eq. 5). Dimensionless."
},
"y0": {
"type": "parameter",
"units": "1",
"default": 0.01,
"description": "Initial mortality rate, rescaled to [0,1] (Scheller & Mladenoff 2004, Eq. 5). Dimensionless."
},
"d": {
"type": "parameter",
"units": "1",
"default": 10.0,
"description": "Age-related mortality shape parameter (Scheller & Mladenoff 2004, Eq. 6). Dimensionless."
},
"k": {
"type": "parameter",
"units": "1/s",
"default": 9.506426344208685e-10,
"description": "Dead biomass decomposition rate (Scheller & Mladenoff 2004, Eq. 7). Default 0.03/yr converted to s^-1: 0.03 / 3.15576e7."
},
"B_MAX_site": {
"type": "parameter",
"units": "kg/m^2",
"default": 50.0,
"description": "Maximum site biomass over all cohorts. Default 500 Mg/ha = 50 kg/m^2 (Scheller & Mladenoff 2004 Table 1)."
},
"B_other": {
"type": "parameter",
"units": "kg/m^2",
"default": 0.0,
"description": "Biomass of all other cohorts at the site (competition term in Eq. 3). When coupled with other cohorts in a multi-cohort site this is driven externally; for the standalone single-cohort model it defaults to zero."
},
"age_init": {
"type": "parameter",
"units": "s",
"default": 315576000.0,
"description": "Initial cohort age (Eq. 1 for cohort_age). Default 10 years in seconds: 10 * 3.15576e7."
},
"B": {
"type": "unknown",
"units": "kg/m^2",
"default": 0.5,
"description": "Aboveground living biomass of the cohort. Default 5 Mg/ha = 0.5 kg/m^2 — a viable initial value for net positive growth under default parameters."
},
"D_wood": {
"type": "unknown",
"units": "kg/m^2",
"default": 0.0,
"description": "Dead woody biomass. Accumulates from cohort mortality, decays at rate k."
},
"cohort_age": {
"type": "unknown",
"units": "s",
"default": 315576000.0,
"description": "Cohort age. Mathematically cohort_age(t) = age_init + t (Eq. 1, drives the M_AGE term in Eq. 6). Carried as a differential state with D(cohort_age)/dt = 1 and initial value = age_init, because the ESS Python runner only plumbs the independent variable t through observed-expression bodies (not algebraic/differential RHS); promoting cohort_age to a tracked state is the standard MTK→ESS workaround. Default 10 years in seconds matches age_init's default — tests that override age_init must also supply cohort_age via initial_conditions to keep the system consistent."
},
"B_MAX": {
"type": "unknown",
"units": "kg/m^2",
"description": "Maximum possible biomass for the species (Eq. 2). Constant in time at ANPP_MAX * B_MAX_ratio."
},
"B_POT": {
"type": "unknown",
"units": "kg/m^2",
"description": "Potential biomass, the available growing space (Eq. 3): max(B, min(B_MAX, B_MAX_site - B_other))."
},
"B_AP": {
"type": "unknown",
"units": "1",
"description": "Ratio of actual to potential biomass, B / B_POT (Eq. 4 auxiliary). Dimensionless. Drives the peaked growth and logistic mortality."
},
"B_PM": {
"type": "unknown",
"units": "1",
"description": "Ratio of potential to maximum biomass, B_POT / B_MAX (Eq. 4 auxiliary). Dimensionless. Damps growth and mortality under competition."
},
"ANPP_ACT": {
"type": "unknown",
"units": "kg/m^2/s",
"description": "Actual ANPP (Eq. 4). Peaked function of B_AP that maxes at B_AP=1, B_PM=1 with value ANPP_MAX."
},
"M_BIO": {
"type": "unknown",
"units": "kg/m^2/s",
"description": "Biomass-related mortality rate (Eq. 5). Logistic in B_AP, scaled by B_PM."
},
"M_AGE": {
"type": "unknown",
"units": "kg/m^2/s",
"description": "Age-related mortality rate (Eq. 6). Exponential in cohort_age, drives senescence as cohort_age approaches max_age."
},
"M_total": {
"type": "unknown",
"units": "kg/m^2/s",
"description": "Total mortality rate, M_BIO + M_AGE."
}
},
"equations": [
{
"lhs": {
"op": "D",
"wrt": "t",
"args": [
"cohort_age"
]
},
"rhs": 1
},
{
"lhs": "B_MAX",
"rhs": {
"op": "*",
"args": [
"ANPP_MAX",
"B_MAX_ratio"
]
}
},
{
"lhs": "B_POT",
"rhs": {
"op": "max",
"args": [
"B",
{
"op": "min",
"args": [
"B_MAX",
{
"op": "+",
"args": [
"B_MAX_site",
{
"op": "*",
"args": [
-1,
"B_other"
]
}
]
}
]
}
]
}
},
{
"lhs": "B_AP",
"rhs": {
"op": "/",
"args": [
"B",
"B_POT"
]
}
},
{
"lhs": "B_PM",
"rhs": {
"op": "/",
"args": [
"B_POT",
"B_MAX"
]
}
},
{
"lhs": "ANPP_ACT",
"rhs": {
"op": "*",
"args": [
"ANPP_MAX",
"e1",
"B_AP",
{
"op": "exp",
"args": [
{
"op": "*",
"args": [
-1,
"B_AP"
]
}
]
},
"B_PM"
]
}
},
{
"lhs": "M_BIO",
"rhs": {
"op": "*",
"args": [
"ANPP_MAX",
{
"op": "/",
"args": [
"y0",
{
"op": "+",
"args": [
"y0",
{
"op": "*",
"args": [
{
"op": "+",
"args": [
1,
{
"op": "*",
"args": [
-1,
"y0"
]
}
]
},
{
"op": "exp",
"args": [
{
"op": "*",
"args": [
-1,
{
"op": "/",
"args": [
"r",
"y0"
]
},
"B_AP"
]
}
]
}
]
}
]
}
]
},
"B_PM"
]
}
},
{
"lhs": "M_AGE",
"rhs": {
"op": "/",
"args": [
{
"op": "*",
"args": [
{
"op": "/",
"args": [
"B",
"one_yr"
]
},
{
"op": "exp",
"args": [
{
"op": "*",
"args": [
{
"op": "/",
"args": [
"cohort_age",
"max_age"
]
},
"d"
]
}
]
}
]
},
{
"op": "exp",
"args": [
"d"
]
}
]
}
},
{
"lhs": "M_total",
"rhs": {
"op": "+",
"args": [
"M_BIO",
"M_AGE"
]
}
},
{
"lhs": {
"op": "D",
"wrt": "t",
"args": [
"B"
]
},
"rhs": {
"op": "+",
"args": [
"ANPP_ACT",
{
"op": "*",
"args": [
-1,
"M_total"
]
}
]
}
},
{
"lhs": {
"op": "D",
"wrt": "t",
"args": [
"D_wood"
]
},
"rhs": {
"op": "+",
"args": [
"M_total",
{
"op": "*",
"args": [
-1,
"k",
"D_wood"
]
}
]
}
}
],
"tests": [
{
"id": "default_initial_state_algebraic",
"description": "Initial-state check (t=0, default A. saccharum parameters, B=0.5 kg/m^2, B_other=0): verifies every algebraic equation at the starting point. cohort_age=age_init=3.15576e8 s; B_MAX=ANPP_MAX*B_MAX_ratio=22.35 kg/m^2; B_POT=max(0.5, min(22.35, 50))=22.35; B_AP=0.5/22.35; B_PM=22.35/22.35=1; ANPP_ACT,M_BIO,M_AGE follow from Eqs. 4-6 evaluated at these auxiliary values. Pins all 9 algebraic variables in one shot at the unique t=0 sample where every result is closed-form.",
"time_span": {
"start": 0.0,
"end": 1.0
},
"assertions": [
{
"variable": "cohort_age",
"time": 0.0,
"expected": 315576000.0
},
{
"variable": "B_MAX",
"time": 0.0,
"expected": 22.35
},
{
"variable": "B_POT",
"time": 0.0,
"expected": 22.35
},
{
"variable": "B_AP",
"time": 0.0,
"expected": 0.022371364653243846
},
{
"variable": "B_PM",
"time": 0.0,
"expected": 1.0
},
{
"variable": "ANPP_ACT",
"time": 0.0,
"expected": 1.403859044134636e-09
},
{
"variable": "M_BIO",
"time": 0.0,
"expected": 2.817916137806815e-10
},
{
"variable": "M_AGE",
"time": 0.0,
"expected": 9.236232116965294e-13
},
{
"variable": "M_total",
"time": 0.0,
"expected": 2.82715236992378e-10
},
{
"variable": "B",
"time": 0.0,
"expected": 0.5
},
{
"variable": "D_wood",
"time": 0.0,
"expected": 0.0
}
]
},
{
"id": "peak_anpp_b_ap_equals_one",
"description": "Set B(0) = B_MAX = 22.35 kg/m^2 so B_AP=1 and B_PM=1: Eq. 4 reduces to ANPP_ACT = ANPP_MAX * e * 1 * exp(-1) * 1 = ANPP_MAX (since e*exp(-1)=1). Verifies the peaked growth function reaches its maximum at B_AP=1. Eq. 5 at B_AP=1 yields M_BIO/ANPP_MAX = y0/(y0 + (1-y0)*exp(-r/y0)) = 0.01/(0.01+0.99*exp(-8)) ≈ 0.968 (the saturated mortality fraction).",
"parameter_overrides": {},
"initial_conditions": {
"B": 22.35,
"D_wood": 0.0
},
"time_span": {
"start": 0.0,
"end": 1.0
},
"assertions": [
{
"variable": "B_AP",
"time": 0.0,
"expected": 1.0
},
{
"variable": "B_PM",
"time": 0.0,
"expected": 1.0
},
{
"variable": "ANPP_ACT",
"time": 0.0,
"expected": 2.360762542145157e-08
},
{
"variable": "M_BIO",
"time": 0.0,
"expected": 2.284879853921591e-08
}
]
},
{
"id": "b_ap_zero_point_four_growth_shape",
"description": "Set B(0) = 0.4 * B_MAX so B_AP = 0.4, B_PM = 1: Eq. 4 yields ANPP_ACT/ANPP_MAX = e * 0.4 * exp(-0.4) ≈ 0.7288 (matches Scheller & Mladenoff 2004 Fig. 2 left-of-peak growth shape). Eq. 5 yields M_BIO/ANPP_MAX = 0.01/(0.01+0.99*exp(-r/y0*0.4)) = 0.01/(0.01+0.99*exp(-3.2)) ≈ 0.199 (paper Fig. 3a mortality fraction at B_AP=0.4).",
"initial_conditions": {
"B": 8.94,
"D_wood": 0.0
},
"time_span": {
"start": 0.0,
"end": 1.0
},
"assertions": [
{
"variable": "B_AP",
"time": 0.0,
"expected": 0.4000000000000001
},
{
"variable": "ANPP_ACT",
"time": 0.0,
"expected": 1.720635924520153e-08
},
{
"variable": "M_BIO",
"time": 0.0,
"expected": 4.688277513701888e-09
}
]
},
{
"id": "competition_reduces_potential",
"description": "Heavy competition: B_other = 49.0 kg/m^2 = 490 Mg/ha. Eq. 3 collapses to B_POT = max(B, min(B_MAX, B_MAX_site - B_other)) = max(0.5, min(22.35, 1.0)) = max(0.5, 1.0) = 1.0 kg/m^2 (= 10 Mg/ha). Then B_AP = 0.5/1.0 = 0.5, B_PM = 1.0/22.35 ≈ 0.04474. Confirms competition shrinks the growing space and damps both growth and mortality through B_PM.",
"parameter_overrides": {
"B_other": 49.0
},
"initial_conditions": {
"B": 0.5,
"D_wood": 0.0
},
"time_span": {
"start": 0.0,
"end": 1.0
},
"assertions": [
{
"variable": "B_POT",
"time": 0.0,
"expected": 1.0
},
{
"variable": "B_AP",
"time": 0.0,
"expected": 0.5
},
{
"variable": "B_PM",
"time": 0.0,
"expected": 0.04474272930648769
}
]
},
{
"id": "age_mortality_at_half_max_age",
"description": "Eq. 6 shape check: cohort at age=200 yr with max_age=400 yr (default). Closed-form: M_AGE = (B/one_yr) * exp((cohort_age/max_age)*d) / exp(d) = (B/yr_to_s) * exp(0.5*10) / exp(10) = (B/yr_to_s) * exp(-5). With B=1.0 kg/m^2 (=10 Mg/ha), M_AGE = 1.0/3.15576e7 * exp(-5) ≈ 2.135e-10 kg/m^2/s. Verifies the exponential age-mortality multiplier crosses exp(-d/2) at half the max age. cohort_age is set as an initial_condition (not the default) because the model carries it as a D(cohort_age)/dt=1 state — see the variables.cohort_age description.",
"parameter_overrides": {
"age_init": 6311520000.0
},
"initial_conditions": {
"B": 1.0,
"D_wood": 0.0,
"cohort_age": 6311520000.0
},
"time_span": {
"start": 0.0,
"end": 1.0
},
"assertions": [
{
"variable": "cohort_age",
"time": 0.0,
"expected": 6311520000.0
},
{
"variable": "M_AGE",
"time": 0.0,
"expected": 2.135126561932931e-10
}
]
},
{
"id": "a_saccharum_200_yr_trajectory",
"description": "Full 200-year integration with A. saccharum defaults (ANPP_MAX=7.45 Mg/ha/yr, max_age=400 yr). Reproduces Scheller & Mladenoff (2004) Fig. 6a: biomass rises through year ~100, peaks around year 150 (~200 Mg/ha), then declines through year 200 (~182 Mg/ha) as age-related mortality dominates. Dead biomass D_wood accumulates from M_total; at year 50 it is ~25 Mg/ha (paper p. 221) and continues climbing to ~252 Mg/ha at year 200 (mortality outpaces decomposition).",
"time_span": {
"start": 0.0,
"end": 6311520000.0
},
"assertions": [
{
"variable": "B",
"time": 1577880000.0,
"expected": 11.825772364272815,
"tolerance": {
"rel": 1e-05
}
},
{
"variable": "B",
"time": 3155760000.0,
"expected": 18.740396419763435,
"tolerance": {
"rel": 1e-05
}
},
{
"variable": "B",
"time": 4733640000.0,
"expected": 20.06435172314673,
"tolerance": {
"rel": 1e-05
}
},
{
"variable": "B",
"time": 6311520000.0,
"expected": 18.198009422403196,
"tolerance": {
"rel": 1e-05
}
},
{
"variable": "D_wood",
"time": 1577880000.0,
"expected": 2.468057442830125,
"tolerance": {
"rel": 1e-05
}
},
{
"variable": "D_wood",
"time": 6311520000.0,
"expected": 25.24843274904028,
"tolerance": {
"rel": 1e-05
}
}
]
},
{
"id": "p_tremuloides_short_lived_peak",
"description": "Scheller & Mladenoff (2004) Fig. 6b — P. tremuloides parameters (ANPP_MAX=7.46 Mg/ha/yr, max_age=120 yr). Shorter-lived species peaks earlier (~year 50 at ~113 Mg/ha) and collapses past max_age=120 as M_AGE explodes. Verifies the longevity parameter shapes the peak position and timing.",
"parameter_overrides": {
"max_age": 3786912000.0,
"ANPP_MAX": 2.3639313509265597e-08
},
"initial_conditions": {
"B": 0.5,
"D_wood": 0.0
},
"time_span": {
"start": 0.0,
"end": 3155760000.0
},
"assertions": [
{
"variable": "B",
"time": 1577880000.0,
"expected": 11.28333519776001,
"tolerance": {
"rel": 1e-05
}
},
{
"variable": "B",
"time": 3155760000.0,
"expected": 0.4999529824777325,
"tolerance": {
"abs": 0.001
}
}
]
},
{
"id": "p_banksiana_very_short_lived",
"description": "Scheller & Mladenoff (2004) Table 2 — P. banksiana parameters (ANPP_MAX=5.77 Mg/ha/yr, max_age=70 yr). Very short-lived species: biomass peaks around year 25 (~31 Mg/ha) and falls below 30 Mg/ha by year 50. Verifies both the lower peak (due to reduced ANPP_MAX) and the earlier crash relative to A. saccharum.",
"parameter_overrides": {
"max_age": 2209032000.0,
"ANPP_MAX": 1.82840266686947e-08
},
"initial_conditions": {
"B": 0.5,
"D_wood": 0.0
},
"time_span": {
"start": 0.0,
"end": 1577880000.0
},
"assertions": [
{
"variable": "B",
"time": 788940000.0,
"expected": 3.065346883368003,
"tolerance": {
"rel": 1e-05
}
},
{
"variable": "B",
"time": 1577880000.0,
"expected": 2.727376030954017,
"tolerance": {
"rel": 1e-05
}
}
]
}
],
"analyses": [
{
"id": "a_saccharum_200yr_default",
"description": "Scheller & Mladenoff (2004) Fig. 6a reproduction — A. saccharum baseline 200-year run with default parameters (ANPP_MAX=7.45 Mg/ha/yr, max_age=400 yr, B(0)=5 Mg/ha). Plots living biomass B(t) and dead woody biomass D_wood(t) over time, showing the characteristic rise to a peak around year ~150 and the steady accumulation of D_wood.",
"initial_state": {
"B": 0.5,
"D_wood": 0.0
},
"time_span": {
"start": 0.0,
"end": 6311520000.0
},
"plots": [
{
"id": "biomass_vs_time",
"type": "line",
"description": "Living biomass B(t) for A. saccharum over 200 years. Rises through year ~100, peaks around year 150 (~200 Mg/ha = 20 kg/m^2), then declines as age-related mortality dominates.",
"x": {
"variable": "t",
"label": "time (s)"
},
"y": {
"variable": "B",
"label": "B (kg/m^2)"
}
},
{
"id": "dead_biomass_vs_time",
"type": "line",
"description": "Dead woody biomass D_wood(t) accumulating from cohort mortality. Reaches ~25 Mg/ha by year 50 (matching Scheller & Mladenoff 2004 p. 221) and continues to climb as mortality outpaces decomposition.",
"x": {
"variable": "t",
"label": "time (s)"
},
"y": {
"variable": "D_wood",
"label": "D_wood (kg/m^2)"
}
}
]
},
{
"id": "species_longevity_sweep",
"description": "Sweep max_age over typical Scheller & Mladenoff (2004) Table 2 species values (70 yr P. banksiana, 120 yr P. tremuloides, 200 yr B. papyrifera, 400 yr A. saccharum, 640 yr T. canadensis). Surfaces the qualitative effect of species longevity on peak timing and the late-time collapse driven by exp((cohort_age/max_age)*d).",
"initial_state": {
"B": 0.5,
"D_wood": 0.0
},
"time_span": {
"start": 0.0,
"end": 6311520000.0
},
"parameter_sweep": {
"type": "cartesian",
"dimensions": [
{
"parameter": "max_age",
"range": {
"start": 2209032000.0,
"stop": 20196864000.0,
"count": 5,
"scale": "linear"
}
}
]
},
"plots": [
{
"id": "biomass_curves_vs_max_age",
"type": "line",
"description": "Family of B(t) trajectories across species longevities. Shorter-lived species peak earlier and lower, then collapse past their max_age; longer-lived species sustain higher biomass through the 200-yr window.",
"x": {
"variable": "t",
"label": "time (s)"
},
"y": {
"variable": "B",
"label": "B (kg/m^2)"
}
}
]
}
]
}