SoilHydraulicProperties
Soil hydraulic properties for an urban-canopy pervious-road soil column following Section 5.3.1 of Oleson et al. (2010, CLM4 Tech Note). Computes five Clapp-Hornberger / Cosby-style properties from the soil sand and clay fractions and the local volumetric water content: saturated hydraulic conductivity k_sat (Eq. 5.70), porosity θ_sat (Eq. 5.71), Clapp-Hornberger exponent B (Eq. 5.72), saturated matric potential ψ_sat (Eq. 5.74), and matric potential ψ (Eq. 5.73, clamped on both sides). Migrated from UrbanCanopy.jl@9200edd4 src/hydrology.jl:322 (`SoilHydraulicProperties` @component). Observed-only: all three inputs are parameters and all five outputs are given by single algebraic equations.
Description
Soil hydraulic properties for an urban-canopy pervious-road soil column following Section 5.3.1 of Oleson et al. (2010, CLM4 Tech Note). Computes five Clapp-Hornberger / Cosby-style properties from the soil sand and clay fractions and the local volumetric water content: saturated hydraulic conductivity k_sat (Eq. 5.70), porosity θ_sat (Eq. 5.71), Clapp-Hornberger exponent B (Eq. 5.72), saturated matric potential ψ_sat (Eq. 5.74), and matric potential ψ (Eq. 5.73, clamped on both sides). Migrated from UrbanCanopy.jl@9200edd4 src/hydrology.jl:322 (SoilHydraulicProperties @component). Observed-only: all three inputs are parameters and all five outputs are given by single algebraic equations.
Reference
_source_ref: UrbanCanopy.jl@9200edd4f15609f20339d3a7d104de8064544310:src/hydrology.jl:322
Upstream SoilHydraulicProperties is an MTK @component whose three inputs (pct_sand, pct_clay, θ_i) are @parameters and whose five outputs (k_sat, θ_sat, B, ψ_sat, ψ) are time-indexed @variables with five algebraic equations (no derivatives). Identical structure preserved here.
Unicode parameter / variable names θ_i, θ_sat, ψ_sat, ψ are preserved from upstream — sibling files in this directory (soil_water_flux.esm, water_table_depth.esm, interface_hydraulic_conductivity.esm, soil_water_content_calc.esm) already established that unicode identifiers are the rig convention for new urban_canopy migrations and the canonical Python runner accepts them.
The upstream component declares three @constants (k_coeff, ψ_coeff, ψ_min); they are encoded here as parameters with the upstream default values, mirroring the convention used by sibling files (groundwater_drainage.esm, surface_runoff_infiltration.esm) for @constants-to-parameter promotion. Default values: k_coeff = 7.0556e-6 m/s (paper’s 0.0070556 mm/s converted to m/s, Eq. 5.70), ψ_coeff = -0.010 m (paper’s -10.0 mm converted to m, Eq. 5.74), ψ_min = -1.0e5 m (paper’s -1e8 mm converted to m). The mm-to-m conversions are applied at the @constants declaration site upstream; this file inherits the SI values so its outputs are SI-consistent without further conversion.
Eq. 5.73 (matric potential) carries two clamps on the water-content ratio (θ_i / θ_sat) to keep ψ finite: an inner max(θ_i, 0.01 * θ_sat) floor on the numerator keeps the ratio ≥ 0.01 (prevents division-by-zero and excessive negative exponents as the soil approaches dryness), and an outer max(..., ψ_min) floor on ψ itself keeps it ≥ -1e5 m even when the inner clamp’s value still produces an absurdly negative matric potential (e.g. at very high B for clay-rich soils). Both clamps are preserved verbatim from upstream Eq. 5.73 — they are physical regularizers, not numerical hacks, and the canonical Python runner reproduces the upstream Julia results to machine precision when both clamps fire.
Observability classification: this component is functionally observed-only — all five output variables are given by single algebraic equations in terms of the parameters (the (t) time index has no role since there is no derivative). Test scenarios use time_span: [0, 1] and sample at t=0 to mirror the convention used by the other observed-only ESM files in this directory (soil_water_flux.esm, water_table_depth.esm, groundwater_drainage.esm, interface_hydraulic_conductivity.esm).
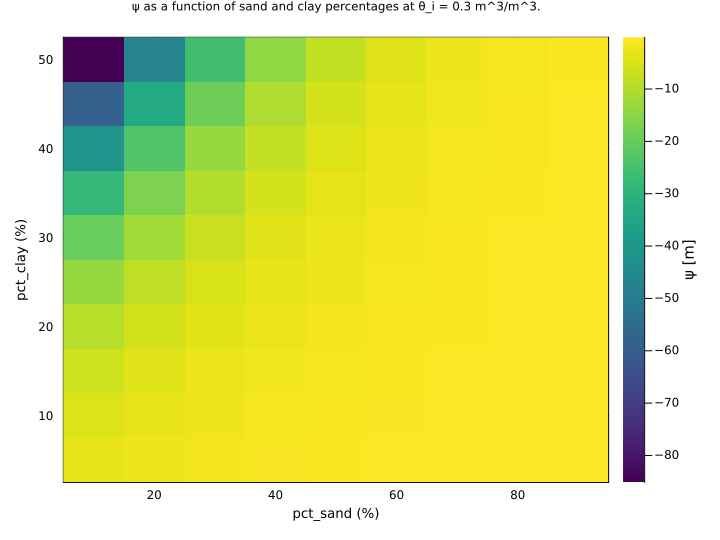
Default parameter values: pct_sand = 50 %, pct_clay = 20 %, θ_i = 0.3 m^3/m^3 — a typical CLMU loam at partial saturation (θ_i ≈ 0.7 × θ_sat). The qualitative-test scenarios in the upstream SoilHydraulicProperties - Qualitative Behavior testitem (UrbanCanopy.jl test/hydrology_test.jl:970) use the same pct_clay = 20, θ_i = 0.3 baseline.
Tolerance rationale (model-level rel=1e-9): observed-only algebraic system (no ODE integration); the five equations involve O(10) IEEE-754 float64 operations each, with k_sat and ψ_sat carrying one ^ (10.0^x) call (≈1 ULP of relative error) and ψ carrying one ^ plus two max calls — worst-case roundoff is ~10*ULP ≈ 1e-15. 1e-9 leaves comfortable headroom and is well below any plausible physical-discrimination scale on soil hydraulic properties (k_sat ∈ [1e-7, 1e-4] m/s across realistic Cosby sand fractions; θ_sat ∈ [0.4, 0.49]; B ∈ [3, 11]; ψ_sat ∈ [-0.8, -0.07] m). Tests that pin upstream test:466’s ≈ rtol=1e-6 assertions use the looser rel: 1e-6 tolerance from the upstream to confirm cross-runner consistency._
Parameters
| Name | Units | Default | Description |
|---|---|---|---|
pct_sand | 1 | 50.0 | Percent sand content of the soil layer (dimensionless mass percent, 0-100) |
pct_clay | 1 | 20.0 | Percent clay content of the soil layer (dimensionless mass percent, 0-100) |
θ_i | m^3/m^3 | 0.3 | Total volumetric soil water content of the layer (Oleson Eq. 5.73 input) |
k_coeff | m/s | 7.0556e-06 | Coefficient for saturated hydraulic conductivity (Oleson Eq. 5.70, converted from 0.0070556 mm/s to 7.0556e-6 m/s) |
ψ_coeff | m | -0.01 | Coefficient for saturated matric potential (Oleson Eq. 5.74, converted from -10.0 mm to -0.010 m) |
ψ_min | m | -100000.0 | Minimum (most-negative) soil matric potential (Oleson Eq. 5.73 outer clamp, converted from -1e8 mm to -1e5 m) |
Observed
| Name | Units | Default | Description |
|---|---|---|---|
k_sat | m/s | Saturated hydraulic conductivity (Oleson Eq. 5.70) | |
θ_sat | m^3/m^3 | Volumetric water content at saturation / porosity (Oleson Eq. 5.71) | |
B | 1 | Clapp-Hornberger exponent (Oleson Eq. 5.72, dimensionless) | |
ψ_sat | m | Saturated soil matric potential (Oleson Eq. 5.74) | |
ψ | m | Soil matric potential (Oleson Eq. 5.73, clamped: inner θ_i/θ_sat ratio ≥ 0.01, outer ψ ≥ ψ_min) |
Observed expressions
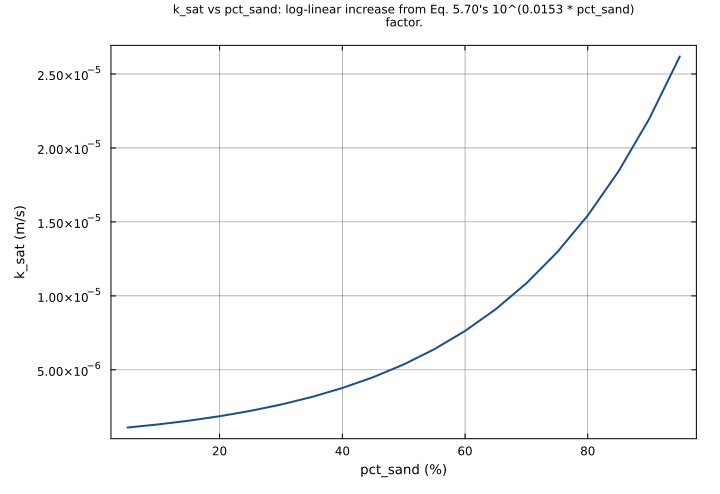
$$ k_{sat} = k_{coeff} \cdot 10.0^{-0.884 + 0.0153 \cdot pct_{sand}} $$Saturated hydraulic conductivity (Oleson Eq. 5.70)
$$ θ_{sat} = 0.489 - 0.00126 \cdot pct_{sand} $$Volumetric water content at saturation / porosity (Oleson Eq. 5.71)
$$ B = 2.91 + 0.159 \cdot pct_{clay} $$Clapp-Hornberger exponent (Oleson Eq. 5.72, dimensionless)
$$ ψ_{sat} = ψ_{coeff} \cdot 10.0^{1.88 - 0.0131 \cdot pct_{sand}} $$Saturated soil matric potential (Oleson Eq. 5.74)
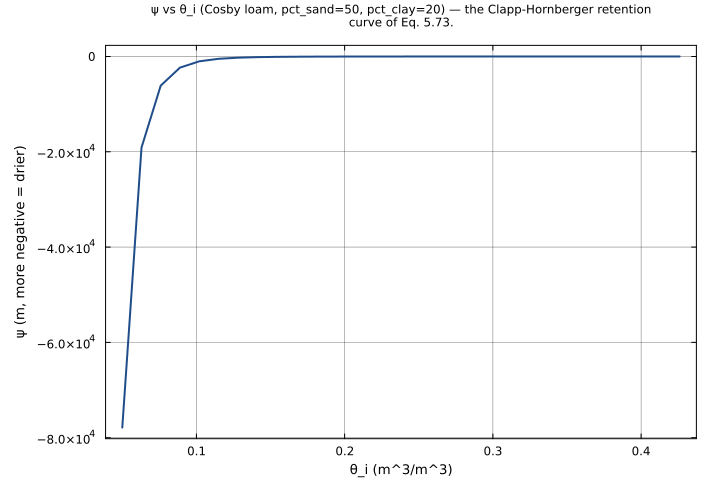
$$ ψ = \mathrm{max}\left(ψ_{sat} \cdot \frac{\mathrm{max}\left(θ_{i}, 0.01 \cdot θ_{sat}\right)}{θ_{sat}}^{\left(-1\right) \cdot B}, ψ_{min}\right) $$Soil matric potential (Oleson Eq. 5.73, clamped: inner θ_i/θ_sat ratio ≥ 0.01, outer ψ ≥ ψ_min)
Analyses
k_sat_vs_pct_sand
Saturated hydraulic conductivity k_sat vs. percent sand content (Eq. 5.70). Sweeping pct_sand from 5 % (clay-rich) to 95 % (nearly-pure sand) traces the canonical Cosby-style log-linear relationship — k_sat increases by ~1.5 decades over the realistic 5-95 % sand range. The y-axis is logarithmic because Eq. 5.70 places pct_sand inside a 10^(0.0153 * pct_sand) factor.
Time span: 0.0 → 1.0
Swept over: pct_sand
psi_retention_curve
Soil-water retention curve: matric potential ψ vs. volumetric water content θ_i for a typical Cosby loam (pct_sand = 50, pct_clay = 20). Sweeps θ_i from 0.05 (very dry) to 0.426 (saturated, θ_sat). Reproduces the canonical Clapp-Hornberger retention curve of Eq. 5.73 — ψ saturates at ψ_sat ≈ -0.168 m near saturation and decreases rapidly toward the inner-clamp regime as θ_i → 0. The y-axis spans many decades so a log-scale view is most informative.
Time span: 0.0 → 1.0
Swept over: θ_i
psi_vs_sand_and_clay
Joint sweep over pct_sand and pct_clay at fixed θ_i = 0.3 m^3/m^3. Surfaces the iso-ψ contours of the soil hydraulic system: ψ depends on all three properties (ψ_sat from sand, B from clay, θ_sat from sand). Clay-rich / low-sand corners exhibit the most negative ψ (high B amplifies the (θ_i / θ_sat)^(-B) factor); high-sand / low-clay corners stay close to ψ_sat (small B, ratio close to 1). The default operating point (sand=50, clay=20) sits in the moderately-negative band.
Time span: 0.0 → 1.0
Swept over: pct_sand, pct_clay
Raw .esm
Raw .esm JSON (this component)
{
"reference": {
"notes": "source_ref: UrbanCanopy.jl@9200edd4f15609f20339d3a7d104de8064544310:src/hydrology.jl:322\nUpstream `SoilHydraulicProperties` is an MTK `@component` whose three inputs (pct_sand, pct_clay, θ_i) are `@parameters` and whose five outputs (k_sat, θ_sat, B, ψ_sat, ψ) are time-indexed `@variables` with five algebraic equations (no derivatives). Identical structure preserved here.\n\nUnicode parameter / variable names θ_i, θ_sat, ψ_sat, ψ are preserved from upstream — sibling files in this directory (soil_water_flux.esm, water_table_depth.esm, interface_hydraulic_conductivity.esm, soil_water_content_calc.esm) already established that unicode identifiers are the rig convention for new urban_canopy migrations and the canonical Python runner accepts them.\n\nThe upstream component declares three `@constants` (k_coeff, ψ_coeff, ψ_min); they are encoded here as parameters with the upstream default values, mirroring the convention used by sibling files (groundwater_drainage.esm, surface_runoff_infiltration.esm) for `@constants`-to-parameter promotion. Default values: k_coeff = 7.0556e-6 m/s (paper's 0.0070556 mm/s converted to m/s, Eq. 5.70), ψ_coeff = -0.010 m (paper's -10.0 mm converted to m, Eq. 5.74), ψ_min = -1.0e5 m (paper's -1e8 mm converted to m). The mm-to-m conversions are applied at the @constants declaration site upstream; this file inherits the SI values so its outputs are SI-consistent without further conversion.\n\nEq. 5.73 (matric potential) carries two clamps on the water-content ratio (θ_i / θ_sat) to keep ψ finite: an inner `max(θ_i, 0.01 * θ_sat)` floor on the numerator keeps the ratio ≥ 0.01 (prevents division-by-zero and excessive negative exponents as the soil approaches dryness), and an outer `max(..., ψ_min)` floor on ψ itself keeps it ≥ -1e5 m even when the inner clamp's value still produces an absurdly negative matric potential (e.g. at very high B for clay-rich soils). Both clamps are preserved verbatim from upstream Eq. 5.73 — they are physical regularizers, not numerical hacks, and the canonical Python runner reproduces the upstream Julia results to machine precision when both clamps fire.\n\nObservability classification: this component is functionally observed-only — all five output variables are given by single algebraic equations in terms of the parameters (the `(t)` time index has no role since there is no derivative). Test scenarios use `time_span: [0, 1]` and sample at t=0 to mirror the convention used by the other observed-only ESM files in this directory (soil_water_flux.esm, water_table_depth.esm, groundwater_drainage.esm, interface_hydraulic_conductivity.esm).\n\nDefault parameter values: pct_sand = 50 %, pct_clay = 20 %, θ_i = 0.3 m^3/m^3 — a typical CLMU loam at partial saturation (θ_i ≈ 0.7 × θ_sat). The qualitative-test scenarios in the upstream `SoilHydraulicProperties - Qualitative Behavior` testitem (UrbanCanopy.jl test/hydrology_test.jl:970) use the same pct_clay = 20, θ_i = 0.3 baseline.\n\nTolerance rationale (model-level rel=1e-9): observed-only algebraic system (no ODE integration); the five equations involve O(10) IEEE-754 float64 operations each, with k_sat and ψ_sat carrying one `^` (10.0^x) call (≈1 ULP of relative error) and ψ carrying one `^` plus two `max` calls — worst-case roundoff is ~10*ULP ≈ 1e-15. 1e-9 leaves comfortable headroom and is well below any plausible physical-discrimination scale on soil hydraulic properties (k_sat ∈ [1e-7, 1e-4] m/s across realistic Cosby sand fractions; θ_sat ∈ [0.4, 0.49]; B ∈ [3, 11]; ψ_sat ∈ [-0.8, -0.07] m). Tests that pin upstream test:466's `≈ rtol=1e-6` assertions use the looser `rel: 1e-6` tolerance from the upstream to confirm cross-runner consistency."
},
"tolerance": {
"rel": 1e-09
},
"variables": {
"pct_sand": {
"type": "parameter",
"units": "1",
"default": 50.0,
"description": "Percent sand content of the soil layer (dimensionless mass percent, 0-100)"
},
"pct_clay": {
"type": "parameter",
"units": "1",
"default": 20.0,
"description": "Percent clay content of the soil layer (dimensionless mass percent, 0-100)"
},
"θ_i": {
"type": "parameter",
"units": "m^3/m^3",
"default": 0.3,
"description": "Total volumetric soil water content of the layer (Oleson Eq. 5.73 input)"
},
"k_coeff": {
"type": "parameter",
"units": "m/s",
"default": 7.0556e-06,
"description": "Coefficient for saturated hydraulic conductivity (Oleson Eq. 5.70, converted from 0.0070556 mm/s to 7.0556e-6 m/s)"
},
"ψ_coeff": {
"type": "parameter",
"units": "m",
"default": -0.01,
"description": "Coefficient for saturated matric potential (Oleson Eq. 5.74, converted from -10.0 mm to -0.010 m)"
},
"ψ_min": {
"type": "parameter",
"units": "m",
"default": -100000.0,
"description": "Minimum (most-negative) soil matric potential (Oleson Eq. 5.73 outer clamp, converted from -1e8 mm to -1e5 m)"
},
"k_sat": {
"type": "unknown",
"units": "m/s",
"description": "Saturated hydraulic conductivity (Oleson Eq. 5.70)"
},
"θ_sat": {
"type": "unknown",
"units": "m^3/m^3",
"description": "Volumetric water content at saturation / porosity (Oleson Eq. 5.71)"
},
"B": {
"type": "unknown",
"units": "1",
"description": "Clapp-Hornberger exponent (Oleson Eq. 5.72, dimensionless)"
},
"ψ_sat": {
"type": "unknown",
"units": "m",
"description": "Saturated soil matric potential (Oleson Eq. 5.74)"
},
"ψ": {
"type": "unknown",
"units": "m",
"description": "Soil matric potential (Oleson Eq. 5.73, clamped: inner θ_i/θ_sat ratio ≥ 0.01, outer ψ ≥ ψ_min)"
}
},
"equations": [
{
"lhs": "k_sat",
"rhs": {
"op": "*",
"args": [
"k_coeff",
{
"op": "^",
"args": [
10.0,
{
"op": "+",
"args": [
-0.884,
{
"op": "*",
"args": [
0.0153,
"pct_sand"
]
}
]
}
]
}
]
}
},
{
"lhs": "θ_sat",
"rhs": {
"op": "-",
"args": [
0.489,
{
"op": "*",
"args": [
0.00126,
"pct_sand"
]
}
]
}
},
{
"lhs": "B",
"rhs": {
"op": "+",
"args": [
2.91,
{
"op": "*",
"args": [
0.159,
"pct_clay"
]
}
]
}
},
{
"lhs": "ψ_sat",
"rhs": {
"op": "*",
"args": [
"ψ_coeff",
{
"op": "^",
"args": [
10.0,
{
"op": "-",
"args": [
1.88,
{
"op": "*",
"args": [
0.0131,
"pct_sand"
]
}
]
}
]
}
]
}
},
{
"lhs": "ψ",
"rhs": {
"op": "max",
"args": [
{
"op": "*",
"args": [
"ψ_sat",
{
"op": "^",
"args": [
{
"op": "/",
"args": [
{
"op": "max",
"args": [
"θ_i",
{
"op": "*",
"args": [
0.01,
"θ_sat"
]
}
]
},
"θ_sat"
]
},
{
"op": "*",
"args": [
-1,
"B"
]
}
]
}
]
},
"ψ_min"
]
}
}
],
"tests": [
{
"id": "eq_verify_saturated",
"description": "Reproduces upstream Equation Verification fixture (UrbanCanopy.jl test/hydrology_test.jl:466) with pct_sand = 50, pct_clay = 20, θ_i = θ_sat. Anchors all five outputs against the Cosby/Clapp-Hornberger closed-form values for a mid-range loam: k_sat = 0.0070556e-3 * 10^(-0.884 + 0.0153 * 50) ≈ 5.365e-6 m/s; θ_sat = 0.489 - 0.00126*50 = 0.426 m^3/m^3; B = 2.91 + 0.159*20 = 6.09; ψ_sat = -0.010 * 10^(1.88 - 0.0131*50) ≈ -0.16788 m. At saturation θ_i = θ_sat the ratio is exactly 1 so ψ = ψ_sat — a key invariant of Eq. 5.73. Tolerances loosened to rel = 1e-6 here to match the upstream Julia test's pinned tolerance and confirm cross-runner consistency (the Python runner reproduces the Julia closed-form to ≈1 ULP, far tighter than 1e-6).",
"parameter_overrides": {
"pct_sand": 50.0,
"pct_clay": 20.0,
"θ_i": 0.426
},
"time_span": {
"start": 0.0,
"end": 1.0
},
"assertions": [
{
"variable": "k_sat",
"time": 0.0,
"expected": 5.364558079579147e-06,
"tolerance": {
"rel": 1e-06
}
},
{
"variable": "θ_sat",
"time": 0.0,
"expected": 0.426,
"tolerance": {
"rel": 1e-06
}
},
{
"variable": "B",
"time": 0.0,
"expected": 6.09,
"tolerance": {
"rel": 1e-06
}
},
{
"variable": "ψ_sat",
"time": 0.0,
"expected": -0.16788040181225597,
"tolerance": {
"rel": 1e-06
}
},
{
"variable": "ψ",
"time": 0.0,
"expected": -0.16788040181225597,
"tolerance": {
"rel": 0.0001
}
}
]
},
{
"id": "typical_partial_saturation",
"description": "Realistic CLMU operating point: pct_sand = 50, pct_clay = 20, θ_i = 0.3 m^3/m^3 (partial saturation, θ_i / θ_sat ≈ 0.7042). k_sat, θ_sat, B, ψ_sat are identical to the eq_verify_saturated case (they depend only on pct_sand and pct_clay), but ψ now reflects the partial-saturation matric potential: ψ = ψ_sat * (0.3/0.426)^(-6.09) ≈ -0.16788 * 8.4768 ≈ -1.42048 m. Neither clamp fires. Anchors the non-equilibrium branch of Eq. 5.73 — the dominant operating regime for the urban-canopy soil column.",
"parameter_overrides": {
"pct_sand": 50.0,
"pct_clay": 20.0,
"θ_i": 0.3
},
"time_span": {
"start": 0.0,
"end": 1.0
},
"assertions": [
{
"variable": "k_sat",
"time": 0.0,
"expected": 5.364558079579147e-06
},
{
"variable": "θ_sat",
"time": 0.0,
"expected": 0.426
},
{
"variable": "B",
"time": 0.0,
"expected": 6.09
},
{
"variable": "ψ_sat",
"time": 0.0,
"expected": -0.16788040181225597
},
{
"variable": "ψ",
"time": 0.0,
"expected": -1.420482923905238
}
]
},
{
"id": "sandy_low_clay_dry",
"description": "Sandy soil with low clay at moderate-to-dry water content: pct_sand = 70, pct_clay = 10, θ_i = 0.15 m^3/m^3. Tests Eq. 5.70-5.74 in the sandy / less-clayey regime: k_sat increases with sand (≈1.085e-5 m/s, ~2× the default loam), θ_sat decreases (0.4008 m^3/m^3), B decreases with clay (4.5), ψ_sat is less negative for sandy soils (≈-0.0918 m). With θ_i / θ_sat ≈ 0.374 and B = 4.5, the (-B) exponent drives ψ to ≈ -7.65 m — moderately dry but well above the ψ_min clamp.",
"parameter_overrides": {
"pct_sand": 70.0,
"pct_clay": 10.0,
"θ_i": 0.15
},
"time_span": {
"start": 0.0,
"end": 1.0
},
"assertions": [
{
"variable": "k_sat",
"time": 0.0,
"expected": 1.0852603880122091e-05
},
{
"variable": "θ_sat",
"time": 0.0,
"expected": 0.4008
},
{
"variable": "B",
"time": 0.0,
"expected": 4.5
},
{
"variable": "ψ_sat",
"time": 0.0,
"expected": -0.09183325964835806
},
{
"variable": "ψ",
"time": 0.0,
"expected": -7.651807612176636
}
]
},
{
"id": "clayey_partial",
"description": "Clay-rich soil at partial saturation: pct_sand = 10, pct_clay = 50, θ_i = 0.3 m^3/m^3. Tests Eq. 5.70-5.74 in the clayey regime — low sand suppresses k_sat (≈1.31e-6 m/s, ~4× lower than the default loam), high clay increases B sharply (10.86 vs 6.09), and ψ_sat is significantly more negative (-0.561 m vs -0.168 m for the default loam). The large B = 10.86 amplifies the (θ_i / θ_sat)^(-B) factor: ψ ≈ -85.16 m — high-clay soils retain water more tightly. Still well above the ψ_min = -1e5 m clamp.",
"parameter_overrides": {
"pct_sand": 10.0,
"pct_clay": 50.0,
"θ_i": 0.3
},
"time_span": {
"start": 0.0,
"end": 1.0
},
"assertions": [
{
"variable": "k_sat",
"time": 0.0,
"expected": 1.3107925113344989e-06
},
{
"variable": "θ_sat",
"time": 0.0,
"expected": 0.4764
},
{
"variable": "B",
"time": 0.0,
"expected": 10.86
},
{
"variable": "ψ_sat",
"time": 0.0,
"expected": -0.5610479760324704
},
{
"variable": "ψ",
"time": 0.0,
"expected": -85.1601483413643
}
]
},
{
"id": "inner_clamp_fires_only",
"description": "Very dry soil where the inner `max(θ_i, 0.01 * θ_sat)` clamp on the ratio fires, but the outer ψ_min clamp does NOT — isolates the inner-clamp branch of Eq. 5.73. pct_sand = 80, pct_clay = 0 (extreme: low B = 2.91), θ_i = 0.001 m^3/m^3. 0.01 * θ_sat = 0.01 * 0.3882 = 0.003882 > θ_i = 0.001, so the ratio is pinned at 0.01. (0.01)^(-2.91) = 100^2.91 = 10^5.82 ≈ 6.607e5. ψ = -0.0679 * 6.607e5 ≈ -44874.54 m, which is more negative than the typical operating range but still > ψ_min = -1e5, so the outer clamp does not engage. Verifies that the inner clamp protects against extreme dryness without prematurely triggering the outer clamp.",
"parameter_overrides": {
"pct_sand": 80.0,
"pct_clay": 0.0,
"θ_i": 0.001
},
"time_span": {
"start": 0.0,
"end": 1.0
},
"assertions": [
{
"variable": "k_sat",
"time": 0.0,
"expected": 1.5435970913938464e-05
},
{
"variable": "θ_sat",
"time": 0.0,
"expected": 0.3882
},
{
"variable": "B",
"time": 0.0,
"expected": 2.91
},
{
"variable": "ψ_sat",
"time": 0.0,
"expected": -0.06792036326171844
},
{
"variable": "ψ",
"time": 0.0,
"expected": -44874.53899331323
}
]
},
{
"id": "both_clamps_fire",
"description": "Extreme dry state where BOTH clamps in Eq. 5.73 fire: pct_sand = 50, pct_clay = 20, θ_i = 0.001 m^3/m^3. 0.01 * θ_sat = 0.00426 > θ_i = 0.001 so the inner clamp pins the ratio at 0.01. (0.01)^(-6.09) = 100^6.09 = 10^12.18 ≈ 1.514e12. ψ_sat * ratio^(-B) ≈ -0.168 * 1.514e12 ≈ -2.541e11 m — far below ψ_min = -1e5. The outer clamp engages and pins ψ at exactly ψ_min = -1.0e5 m. Verifies the outer-clamp branch and confirms that the IEEE-754 result hits ψ_min exactly (abs = 1e-15 floor).",
"parameter_overrides": {
"pct_sand": 50.0,
"pct_clay": 20.0,
"θ_i": 0.001
},
"time_span": {
"start": 0.0,
"end": 1.0
},
"assertions": [
{
"variable": "k_sat",
"time": 0.0,
"expected": 5.364558079579147e-06
},
{
"variable": "θ_sat",
"time": 0.0,
"expected": 0.426
},
{
"variable": "B",
"time": 0.0,
"expected": 6.09
},
{
"variable": "ψ_sat",
"time": 0.0,
"expected": -0.16788040181225597
},
{
"variable": "ψ",
"time": 0.0,
"expected": -100000.0,
"tolerance": {
"abs": 1e-10
}
}
]
},
{
"id": "qual_low_sand_ksat",
"description": "Lower-sand monotonicity-check anchor for the upstream `SoilHydraulicProperties - Qualitative Behavior` testitem (UrbanCanopy.jl test/hydrology_test.jl:982): higher sand content should produce higher k_sat (Eq. 5.70's 10^(0.0153 * pct_sand) factor is monotone-increasing in pct_sand). At pct_sand = 20, pct_clay = 20, θ_i = 0.3: k_sat ≈ 1.864e-6 m/s, θ_sat = 0.4638 m^3/m^3 (higher porosity for clay-rich soils, consistent with Eq. 5.71's negative sand-dependence), ψ_sat ≈ -0.415 m (more negative, also consistent with Eq. 5.74). Pairs with qual_high_sand_ksat to verify the k_sat / θ_sat / ψ_sat sand-dependence directions.",
"parameter_overrides": {
"pct_sand": 20.0,
"pct_clay": 20.0,
"θ_i": 0.3
},
"time_span": {
"start": 0.0,
"end": 1.0
},
"assertions": [
{
"variable": "k_sat",
"time": 0.0,
"expected": 1.8643779228160723e-06
},
{
"variable": "θ_sat",
"time": 0.0,
"expected": 0.4638
},
{
"variable": "B",
"time": 0.0,
"expected": 6.09
},
{
"variable": "ψ_sat",
"time": 0.0,
"expected": -0.41495404263436286
},
{
"variable": "ψ",
"time": 0.0,
"expected": -5.892312769696793
}
]
},
{
"id": "qual_high_sand_ksat",
"description": "Higher-sand monotonicity-check companion to qual_low_sand_ksat: at pct_sand = 80 (other parameters held: pct_clay = 20, θ_i = 0.3), k_sat ≈ 1.544e-5 m/s — about 8.3× larger than the pct_sand = 20 value, confirming Eq. 5.70's strong sand-dependence (decade per ~65 % sand). θ_sat drops to 0.3882 m^3/m^3 (lower porosity in sandy soils) and ψ_sat rises to ≈ -0.0679 m (less negative — sandy soils are less retentive). B = 6.09 is unchanged since it depends only on clay. ψ ≈ -0.326 m — less negative than the loam at the same θ_i / θ_sat because the higher θ_sat-relative ratio (0.3 / 0.3882 ≈ 0.773) keeps the (-B)-power factor closer to 1.",
"parameter_overrides": {
"pct_sand": 80.0,
"pct_clay": 20.0,
"θ_i": 0.3
},
"time_span": {
"start": 0.0,
"end": 1.0
},
"assertions": [
{
"variable": "k_sat",
"time": 0.0,
"expected": 1.5435970913938464e-05
},
{
"variable": "θ_sat",
"time": 0.0,
"expected": 0.3882
},
{
"variable": "B",
"time": 0.0,
"expected": 6.09
},
{
"variable": "ψ_sat",
"time": 0.0,
"expected": -0.06792036326171844
},
{
"variable": "ψ",
"time": 0.0,
"expected": -0.3263470887762197
}
]
}
],
"analyses": [
{
"id": "k_sat_vs_pct_sand",
"description": "Saturated hydraulic conductivity k_sat vs. percent sand content (Eq. 5.70). Sweeping pct_sand from 5 % (clay-rich) to 95 % (nearly-pure sand) traces the canonical Cosby-style log-linear relationship — k_sat increases by ~1.5 decades over the realistic 5-95 % sand range. The y-axis is logarithmic because Eq. 5.70 places pct_sand inside a 10^(0.0153 * pct_sand) factor.",
"initial_state": {},
"parameters": {
"pct_clay": 20.0,
"θ_i": 0.3
},
"time_span": {
"start": 0.0,
"end": 1.0
},
"parameter_sweep": {
"type": "cartesian",
"dimensions": [
{
"parameter": "pct_sand",
"range": {
"start": 5.0,
"stop": 95.0,
"count": 19,
"scale": "linear"
}
}
]
},
"plots": [
{
"id": "k_sat_curve",
"type": "line",
"description": "k_sat vs pct_sand: log-linear increase from Eq. 5.70's 10^(0.0153 * pct_sand) factor.",
"x": {
"variable": "pct_sand",
"label": "pct_sand (%)"
},
"y": {
"variable": "k_sat",
"label": "k_sat (m/s)"
}
}
]
},
{
"id": "psi_retention_curve",
"description": "Soil-water retention curve: matric potential ψ vs. volumetric water content θ_i for a typical Cosby loam (pct_sand = 50, pct_clay = 20). Sweeps θ_i from 0.05 (very dry) to 0.426 (saturated, θ_sat). Reproduces the canonical Clapp-Hornberger retention curve of Eq. 5.73 — ψ saturates at ψ_sat ≈ -0.168 m near saturation and decreases rapidly toward the inner-clamp regime as θ_i → 0. The y-axis spans many decades so a log-scale view is most informative.",
"initial_state": {},
"parameters": {
"pct_sand": 50.0,
"pct_clay": 20.0
},
"time_span": {
"start": 0.0,
"end": 1.0
},
"parameter_sweep": {
"type": "cartesian",
"dimensions": [
{
"parameter": "θ_i",
"range": {
"start": 0.05,
"stop": 0.426,
"count": 30,
"scale": "linear"
}
}
]
},
"plots": [
{
"id": "psi_curve",
"type": "line",
"description": "ψ vs θ_i (Cosby loam, pct_sand=50, pct_clay=20) — the Clapp-Hornberger retention curve of Eq. 5.73.",
"x": {
"variable": "θ_i",
"label": "θ_i (m^3/m^3)"
},
"y": {
"variable": "ψ",
"label": "ψ (m, more negative = drier)"
}
}
]
},
{
"id": "psi_vs_sand_and_clay",
"description": "Joint sweep over pct_sand and pct_clay at fixed θ_i = 0.3 m^3/m^3. Surfaces the iso-ψ contours of the soil hydraulic system: ψ depends on all three properties (ψ_sat from sand, B from clay, θ_sat from sand). Clay-rich / low-sand corners exhibit the most negative ψ (high B amplifies the (θ_i / θ_sat)^(-B) factor); high-sand / low-clay corners stay close to ψ_sat (small B, ratio close to 1). The default operating point (sand=50, clay=20) sits in the moderately-negative band.",
"initial_state": {},
"parameters": {
"θ_i": 0.3
},
"time_span": {
"start": 0.0,
"end": 1.0
},
"parameter_sweep": {
"type": "cartesian",
"dimensions": [
{
"parameter": "pct_sand",
"range": {
"start": 10.0,
"stop": 90.0,
"count": 9,
"scale": "linear"
}
},
{
"parameter": "pct_clay",
"range": {
"start": 5.0,
"stop": 50.0,
"count": 10,
"scale": "linear"
}
}
]
},
"plots": [
{
"id": "psi_heatmap",
"type": "heatmap",
"description": "ψ as a function of sand and clay percentages at θ_i = 0.3 m^3/m^3.",
"x": {
"variable": "pct_sand",
"label": "pct_sand (%)"
},
"y": {
"variable": "pct_clay",
"label": "pct_clay (%)"
},
"value": {
"variable": "ψ",
"reduce": "final"
}
}
]
}
]
}