TotalMolarConcentration
Total molar concentration of air from the ideal gas law: c_total = N/V = p / (R * T) (Seinfeld & Pandis Eq. 1.7). Migrated from AtmosphericDynamics.jl@816cc391 src/seinfeld_pandis_ch1.jl:244 (`TotalMolarConcentration` @component). Algebraic (observed-only): T and p are input parameters; c_total is the algebraic output fixed by one explicit equation. Upstream the Julia @component declares T and p as @variables for composition into a parent system; for standalone serialization (3 unknowns vs 1 equation otherwise), they are declared as parameters here, mirroring the sibling ideal_gas.esm / sat_vapor_pressure.esm pattern.
Description
Total molar concentration of air from the ideal gas law: c_total = N/V = p / (R * T) (Seinfeld & Pandis Eq. 1.7). Migrated from AtmosphericDynamics.jl@816cc391 src/seinfeld_pandis_ch1.jl:244 (TotalMolarConcentration @component). Algebraic (observed-only): T and p are input parameters; c_total is the algebraic output fixed by one explicit equation. Upstream the Julia @component declares T and p as @variables for composition into a parent system; for standalone serialization (3 unknowns vs 1 equation otherwise), they are declared as parameters here, mirroring the sibling ideal_gas.esm / sat_vapor_pressure.esm pattern.
Reference
_source_ref: AtmosphericDynamics.jl@816cc391:src/seinfeld_pandis_ch1.jl:244
Upstream TotalMolarConcentration is an MTK @component where T and p are @variables driven by a parent system and R is a @constant (R_GAS). For standalone serialization (and to make the component well-posed in isolation), T and p are declared as parameters here — matching the (S, observed-only) classification in docs/migration-tracker.md and the sibling ideal_gas.esm. The constant value R = 8.314 J/(mol*K) comes from the upstream module’s R_GAS (Seinfeld & Pandis Appendix A); it is declared as a parameter named R — the ESS schema’s reserved physical-constant name for the ideal gas constant — with dimensionally-compatible units J/mol/K. c_total is the single algebraic state output, fixed by one explicit equation (matching upstream length(eqs) == 1); system_kind is left unset (zero differential states), consistent with siblings ideal_gas.esm / sat_vapor_pressure.esm.
Tolerance rationale (model-level rel=1e-6): observed-only single-equation algebraic system (no ODE integration); 1e-6 covers float64 roundoff in the closed-form p / (R * T) expression across the atmospheric T range (216-313 K) and p range (22.6-110 kPa)._
Parameters
| Name | Units | Default | Description |
|---|---|---|---|
T | K | 298.15 | Temperature |
p | Pa | 101325.0 | Atmospheric pressure |
R | J/mol/K | 8.314 | Universal gas constant (Seinfeld & Pandis Appendix A) |
Observed
| Name | Units | Default | Description |
|---|---|---|---|
c_total | mol/m^3 | Total molar concentration of air |
Observed expressions
$$ c_{total} = \frac{p}{R \cdot T} $$Total molar concentration of air
Analyses
c_total_vs_temperature_at_sea_level_pressure
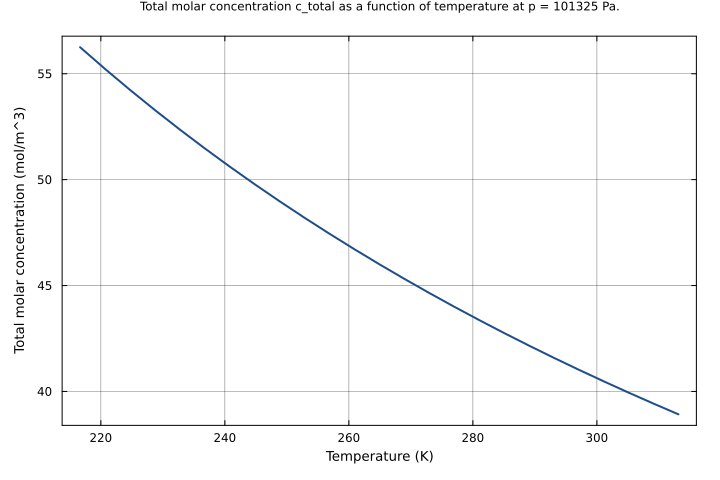
Total molar concentration as a function of temperature at sea-level pressure (p = 101325 Pa). Reproduces the canonical inverse-temperature curve of Seinfeld & Pandis Eq. 1.7 across the atmospheric range (216-313 K).
Time span: 0.0 → 1.0
Swept over: T
c_total_vs_pressure_at_standard_T
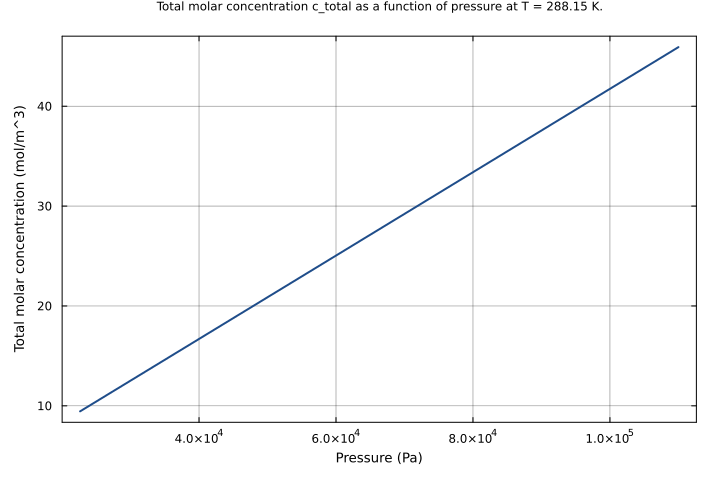
Total molar concentration as a function of pressure at standard sea-level temperature (T = 288.15 K). Verifies linear scaling c_total proportional to p across the tropospheric pressure range (22.6-110 kPa).
Time span: 0.0 → 1.0
Swept over: p
coupled_T_and_p_sweep
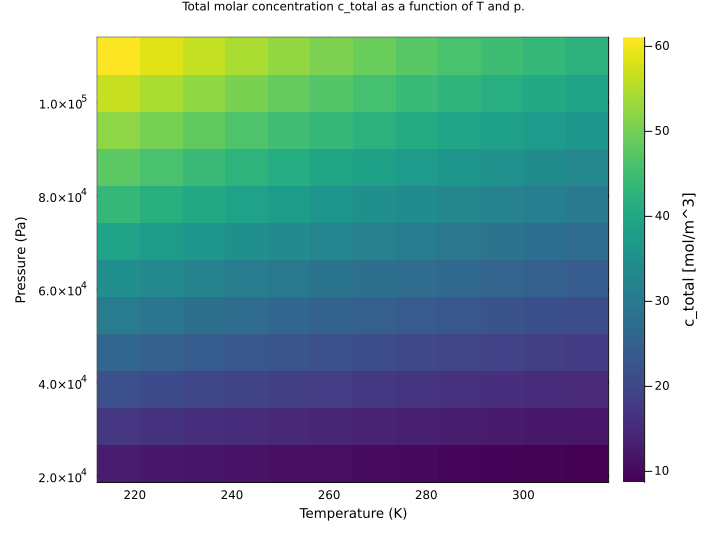
Two-dimensional sweep over T (cold tropopause to hot surface) and p (tropopause to above-sea-level). Surfaces the joint dependence of c_total on temperature and pressure.
Time span: 0.0 → 1.0
Swept over: T, p
Raw .esm
Raw .esm JSON (this component)
{
  "reference": {
    "notes": "source_ref: AtmosphericDynamics.jl@816cc391:src/seinfeld_pandis_ch1.jl:244\nUpstream `TotalMolarConcentration` is an MTK `@component` where T and p are `@variables` driven by a parent system and R is a `@constant` (R_GAS). For standalone serialization (and to make the component well-posed in isolation), T and p are declared as parameters here — matching the (S, observed-only) classification in docs/migration-tracker.md and the sibling ideal_gas.esm. The constant value R = 8.314 J/(mol*K) comes from the upstream module's `R_GAS` (Seinfeld & Pandis Appendix A); it is declared as a parameter named `R` — the ESS schema's reserved physical-constant name for the ideal gas constant — with dimensionally-compatible units J/mol/K. c_total is the single algebraic `state` output, fixed by one explicit equation (matching upstream `length(eqs) == 1`); `system_kind` is left unset (zero differential states), consistent with siblings ideal_gas.esm / sat_vapor_pressure.esm.\n\nTolerance rationale (model-level rel=1e-6): observed-only single-equation algebraic system (no ODE integration); 1e-6 covers float64 roundoff in the closed-form p / (R * T) expression across the atmospheric T range (216-313 K) and p range (22.6-110 kPa)."
  },
  "tolerance": {
    "rel": 1e-06
  },
  "variables": {
    "T": {
      "type": "parameter",
      "units": "K",
      "default": 298.15,
      "description": "Temperature"
    },
    "p": {
      "type": "parameter",
      "units": "Pa",
      "default": 101325.0,
      "description": "Atmospheric pressure"
    },
    "R": {
      "type": "parameter",
      "units": "J/mol/K",
      "default": 8.314,
      "description": "Universal gas constant (Seinfeld & Pandis Appendix A)"
    },
    "c_total": {
      "type": "unknown",
      "units": "mol/m^3",
      "description": "Total molar concentration of air"
    }
  },
  "equations": [
    {
      "_comment": "Eq. 1.7 - Total molar concentration of air from the ideal gas law: c_total = p / (R * T)",
      "lhs": "c_total",
      "rhs": {
        "op": "/",
        "args": [
          "p",
          {
            "op": "*",
            "args": [
              "R",
              "T"
            ]
          }
        ]
      }
    }
  ],
  "tests": [
    {
      "id": "std_sea_level",
      "description": "U.S. Standard Atmosphere sea-level reference: T=288.15 K, p=101325 Pa. c_total = 42.29 mol/m^3.",
      "parameter_overrides": {
        "T": 288.15,
        "p": 101325.0
      },
      "time_span": {
        "start": 0.0,
        "end": 1.0
      },
      "assertions": [
        {
          "variable": "c_total",
          "time": 0.0,
          "expected": 42.29489667460054
        }
      ]
    },
    {
      "id": "zero_celsius",
      "description": "Standard pressure at the freezing point of water: T=273.15 K, p=101325 Pa. This is the standard-temperature-and-pressure (STP) anchor of Seinfeld & Pandis Eq. 1.7: c_total = 44.62 mol/m^3 (spec value ~44.6 mol/m^3).",
      "parameter_overrides": {
        "T": 273.15,
        "p": 101325.0
      },
      "time_span": {
        "start": 0.0,
        "end": 1.0
      },
      "assertions": [
        {
          "variable": "c_total",
          "time": 0.0,
          "expected": 44.617515931854825
        }
      ]
    },
    {
      "id": "std_25C",
      "description": "Standard laboratory conditions: T=298.15 K (25°C), p=101325 Pa. c_total = 40.88 mol/m^3 — adjacent to the Seinfeld & Pandis spec anchor at T=298 K, p=101325 Pa (~40.9 mol/m^3).",
      "parameter_overrides": {
        "T": 298.15,
        "p": 101325.0
      },
      "time_span": {
        "start": 0.0,
        "end": 1.0
      },
      "assertions": [
        {
          "variable": "c_total",
          "time": 0.0,
          "expected": 40.87631888910329
        }
      ]
    },
    {
      "id": "tropopause_11km",
      "description": "U.S. Standard Atmosphere tropopause (~11 km): T=216.65 K, p=22632 Pa. Exercises the cold/low-pressure regime; c_total = 12.56 mol/m^3.",
      "parameter_overrides": {
        "T": 216.65,
        "p": 22632.0
      },
      "time_span": {
        "start": 0.0,
        "end": 1.0
      },
      "assertions": [
        {
          "variable": "c_total",
          "time": 0.0,
          "expected": 12.56476067634077
        }
      ]
    },
    {
      "id": "hot_surface",
      "description": "Hot summertime surface: T=313.15 K (40°C), p=101325 Pa. c_total = 38.92 mol/m^3.",
      "parameter_overrides": {
        "T": 313.15,
        "p": 101325.0
      },
      "time_span": {
        "start": 0.0,
        "end": 1.0
      },
      "assertions": [
        {
          "variable": "c_total",
          "time": 0.0,
          "expected": 38.91832820305331
        }
      ]
    },
    {
      "id": "cold_surface",
      "description": "Wintertime polar surface: T=253.15 K (-20°C), p=101325 Pa. c_total = 48.14 mol/m^3.",
      "parameter_overrides": {
        "T": 253.15,
        "p": 101325.0
      },
      "time_span": {
        "start": 0.0,
        "end": 1.0
      },
      "assertions": [
        {
          "variable": "c_total",
          "time": 0.0,
          "expected": 48.14250237719195
        }
      ]
    },
    {
      "id": "mid_troposphere",
      "description": "Approximate mid-troposphere (~5 km): T=255.65 K, p=54020 Pa. Joint cold-and-low-pressure case; c_total = 25.42 mol/m^3.",
      "parameter_overrides": {
        "T": 255.65,
        "p": 54020.0
      },
      "time_span": {
        "start": 0.0,
        "end": 1.0
      },
      "assertions": [
        {
          "variable": "c_total",
          "time": 0.0,
          "expected": 25.415506121669516
        }
      ]
    },
    {
      "id": "low_pressure",
      "description": "Half-pressure case at sea-level temperature: T=288.15 K, p=50000 Pa. Verifies linear scaling of c_total with p at fixed T; c_total = 20.87 mol/m^3.",
      "parameter_overrides": {
        "T": 288.15,
        "p": 50000.0
      },
      "time_span": {
        "start": 0.0,
        "end": 1.0
      },
      "assertions": [
        {
          "variable": "c_total",
          "time": 0.0,
          "expected": 20.870908795756495
        }
      ]
    },
    {
      "id": "high_pressure",
      "description": "Above-standard pressure case at sea-level temperature: T=288.15 K, p=110000 Pa. c_total = 45.92 mol/m^3.",
      "parameter_overrides": {
        "T": 288.15,
        "p": 110000.0
      },
      "time_span": {
        "start": 0.0,
        "end": 1.0
      },
      "assertions": [
        {
          "variable": "c_total",
          "time": 0.0,
          "expected": 45.915999350664286
        }
      ]
    }
  ],
  "analyses": [
    {
      "id": "c_total_vs_temperature_at_sea_level_pressure",
      "description": "Total molar concentration as a function of temperature at sea-level pressure (p = 101325 Pa). Reproduces the canonical inverse-temperature curve of Seinfeld & Pandis Eq. 1.7 across the atmospheric range (216-313 K).",
      "initial_state": {},
      "parameters": {
        "p": 101325.0
      },
      "time_span": {
        "start": 0.0,
        "end": 1.0
      },
      "parameter_sweep": {
        "type": "cartesian",
        "dimensions": [
          {
            "parameter": "T",
            "range": {
              "start": 216.65,
              "stop": 313.15,
              "count": 25,
              "scale": "linear"
            }
          }
        ]
      },
      "plots": [
        {
          "id": "c_total_vs_T",
          "type": "line",
          "description": "Total molar concentration c_total as a function of temperature at p = 101325 Pa.",
          "x": {
            "variable": "T",
            "label": "Temperature (K)"
          },
          "y": {
            "variable": "c_total",
            "label": "Total molar concentration (mol/m^3)"
          }
        }
      ]
    },
    {
      "id": "c_total_vs_pressure_at_standard_T",
      "description": "Total molar concentration as a function of pressure at standard sea-level temperature (T = 288.15 K). Verifies linear scaling c_total proportional to p across the tropospheric pressure range (22.6-110 kPa).",
      "initial_state": {},
      "parameters": {
        "T": 288.15
      },
      "time_span": {
        "start": 0.0,
        "end": 1.0
      },
      "parameter_sweep": {
        "type": "cartesian",
        "dimensions": [
          {
            "parameter": "p",
            "range": {
              "start": 22632.0,
              "stop": 110000.0,
              "count": 20,
              "scale": "linear"
            }
          }
        ]
      },
      "plots": [
        {
          "id": "c_total_vs_p",
          "type": "line",
          "description": "Total molar concentration c_total as a function of pressure at T = 288.15 K.",
          "x": {
            "variable": "p",
            "label": "Pressure (Pa)"
          },
          "y": {
            "variable": "c_total",
            "label": "Total molar concentration (mol/m^3)"
          }
        }
      ]
    },
    {
      "id": "coupled_T_and_p_sweep",
      "description": "Two-dimensional sweep over T (cold tropopause to hot surface) and p (tropopause to above-sea-level). Surfaces the joint dependence of c_total on temperature and pressure.",
      "initial_state": {},
      "parameters": {},
      "time_span": {
        "start": 0.0,
        "end": 1.0
      },
      "parameter_sweep": {
        "type": "cartesian",
        "dimensions": [
          {
            "parameter": "T",
            "range": {
              "start": 216.65,
              "stop": 313.15,
              "count": 12,
              "scale": "linear"
            }
          },
          {
            "parameter": "p",
            "range": {
              "start": 22632.0,
              "stop": 110000.0,
              "count": 12,
              "scale": "linear"
            }
          }
        ]
      },
      "plots": [
        {
          "id": "c_total_heatmap",
          "type": "heatmap",
          "description": "Total molar concentration c_total as a function of T and p.",
          "x": {
            "variable": "T",
            "label": "Temperature (K)"
          },
          "y": {
            "variable": "p",
            "label": "Pressure (Pa)"
          },
          "value": {
            "variable": "c_total",
            "reduce": "final"
          }
        }
      ]
    }
  ]
}