ScaleHeight
Atmospheric scale height H = R*T/(M_air*g) — the altitude increase over which atmospheric pressure decreases by a factor of e (~2.718) for an isothermal atmosphere. Migrated from AtmosphericDynamics.jl@816cc391 src/seinfeld_pandis_ch1.jl:109 (`ScaleHeight` @component). Implements Seinfeld & Pandis Eq. 1.4. Parameterized as observed-only: T is an input parameter, H is the algebraic observed output.
Description
Atmospheric scale height H = RT/(M_airg) — the altitude increase over which atmospheric pressure decreases by a factor of e (~2.718) for an isothermal atmosphere. Migrated from AtmosphericDynamics.jl@816cc391 src/seinfeld_pandis_ch1.jl:109 (ScaleHeight @component). Implements Seinfeld & Pandis Eq. 1.4. Parameterized as observed-only: T is an input parameter, H is the algebraic observed output.
Reference
_source_ref: AtmosphericDynamics.jl@816cc391:src/seinfeld_pandis_ch1.jl:109
Upstream ScaleHeight is an MTK @component with R, M_air, g as @constants and T(t), H(t) as @variables. For standalone serialization (and to make the component well-posed in isolation), R, M_air, g, and T are declared as parameters here — matching the bead’s (S, observed-only) classification. The single algebraic equation H = RT/(M_airg) is unchanged from upstream.
Tolerance rationale (model-level rel=1e-6): observed-only algebraic system (no ODE integration); 1e-6 covers float64 roundoff in the multiply/divide chain across the atmospheric T range (200–320 K)._
Parameters
| Name | Units | Default | Description |
|---|---|---|---|
T | K | 288.0 | Temperature (sea-level standard 288 K) |
R | J/(mol*K) | 8.314 | Universal gas constant |
M_air | kg/mol | 0.02897 | Molecular weight of dry air (28.97 g/mol) |
g | m/s^2 | 9.807 | Gravitational acceleration |
Observed
| Name | Units | Default | Description |
|---|---|---|---|
H | m | Atmospheric scale height (altitude over which pressure falls by factor e) |
Observed expressions
$$ H = \frac{R \cdot T}{M_{air} \cdot g} $$Atmospheric scale height (altitude over which pressure falls by factor e)
Analyses
scale_height_vs_temperature
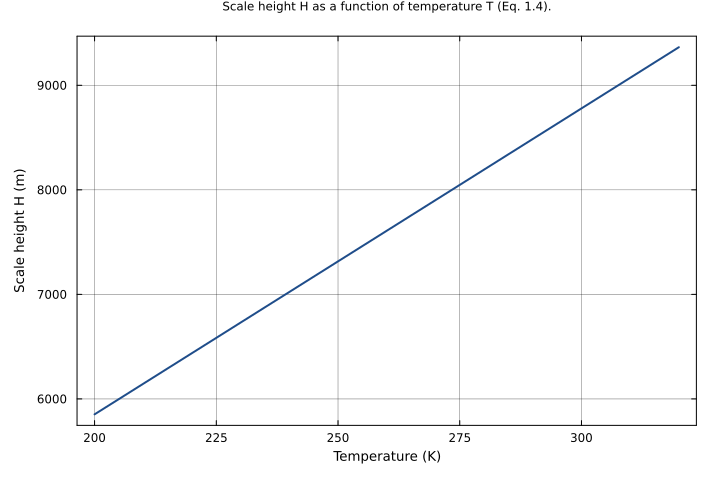
Reproduces the classical H(T) curve over the atmospheric temperature range (200–320 K). Scale height grows linearly with T; the textbook reference points (7.4 km at 253 K; 8.4 km at 288 K) lie on this line.
Time span: 0.0 → 1.0
Swept over: T
Raw .esm
Raw .esm JSON (this component)
{
  "reference": {
    "notes": "source_ref: AtmosphericDynamics.jl@816cc391:src/seinfeld_pandis_ch1.jl:109\nUpstream `ScaleHeight` is an MTK `@component` with R, M_air, g as `@constants` and T(t), H(t) as `@variables`. For standalone serialization (and to make the component well-posed in isolation), R, M_air, g, and T are declared as parameters here — matching the bead's `(S, observed-only)` classification. The single algebraic equation H = R*T/(M_air*g) is unchanged from upstream.\n\nTolerance rationale (model-level rel=1e-6): observed-only algebraic system (no ODE integration); 1e-6 covers float64 roundoff in the multiply/divide chain across the atmospheric T range (200–320 K)."
  },
  "tolerance": {
    "rel": 1e-06
  },
  "variables": {
    "T": {
      "type": "parameter",
      "units": "K",
      "default": 288.0,
      "description": "Temperature (sea-level standard 288 K)"
    },
    "R": {
      "type": "parameter",
      "units": "J/(mol*K)",
      "default": 8.314,
      "description": "Universal gas constant"
    },
    "M_air": {
      "type": "parameter",
      "units": "kg/mol",
      "default": 0.02897,
      "description": "Molecular weight of dry air (28.97 g/mol)"
    },
    "g": {
      "type": "parameter",
      "units": "m/s^2",
      "default": 9.807,
      "description": "Gravitational acceleration"
    },
    "H": {
      "type": "unknown",
      "units": "m",
      "description": "Atmospheric scale height (altitude over which pressure falls by factor e)"
    }
  },
  "equations": [
    {
      "lhs": "H",
      "rhs": {
        "op": "/",
        "args": [
          {
            "op": "*",
            "args": [
              "R",
              "T"
            ]
          },
          {
            "op": "*",
            "args": [
              "M_air",
              "g"
            ]
          }
        ]
      }
    }
  ],
  "tests": [
    {
      "id": "sea_level_288K",
      "description": "Sea-level standard atmosphere (T = 288 K). Seinfeld & Pandis textbook value: H ≈ 8.4 km. Computed: 8427.87 m.",
      "parameter_overrides": {
        "T": 288.0
      },
      "time_span": {
        "start": 0.0,
        "end": 1.0
      },
      "assertions": [
        {
          "variable": "H",
          "time": 0.0,
          "expected": 8427.870183108378
        }
      ]
    },
    {
      "id": "cold_253K",
      "description": "Cold mid-troposphere reference (T = 253 K). Seinfeld & Pandis textbook value: H ≈ 7.4 km. Computed: 7403.65 m.",
      "parameter_overrides": {
        "T": 253.0
      },
      "time_span": {
        "start": 0.0,
        "end": 1.0
      },
      "assertions": [
        {
          "variable": "H",
          "time": 0.0,
          "expected": 7403.649848355624
        }
      ]
    },
    {
      "id": "freezing_273K",
      "description": "Freezing-point reference (T = 273.15 K).",
      "parameter_overrides": {
        "T": 273.15
      },
      "time_span": {
        "start": 0.0,
        "end": 1.0
      },
      "assertions": [
        {
          "variable": "H",
          "time": 0.0,
          "expected": 7993.308126791852
        }
      ]
    },
    {
      "id": "room_temp_298K",
      "description": "Room-temperature reference (T = 298.0 K) — common analysis baseline alongside other Seinfeld & Pandis components.",
      "parameter_overrides": {
        "T": 298.0
      },
      "time_span": {
        "start": 0.0,
        "end": 1.0
      },
      "assertions": [
        {
          "variable": "H",
          "time": 0.0,
          "expected": 8720.50456446631
        }
      ]
    },
    {
      "id": "warm_318K",
      "description": "Upper-range reference (T = 318 K, ~45 °C) — covers warm boundary-layer / continental summer conditions.",
      "parameter_overrides": {
        "T": 318.0
      },
      "time_span": {
        "start": 0.0,
        "end": 1.0
      },
      "assertions": [
        {
          "variable": "H",
          "time": 0.0,
          "expected": 9305.773327182167
        }
      ]
    },
    {
      "id": "linearity_in_T",
      "description": "H is linear in T at fixed (R, M_air, g): doubling T must double H. Cross-check on the algebraic structure.",
      "parameter_overrides": {
        "T": 576.0
      },
      "time_span": {
        "start": 0.0,
        "end": 1.0
      },
      "assertions": [
        {
          "variable": "H",
          "time": 0.0,
          "expected": 16855.740366216756
        }
      ]
    }
  ],
  "analyses": [
    {
      "id": "scale_height_vs_temperature",
      "description": "Reproduces the classical H(T) curve over the atmospheric temperature range (200–320 K). Scale height grows linearly with T; the textbook reference points (7.4 km at 253 K; 8.4 km at 288 K) lie on this line.",
      "initial_state": {},
      "parameters": {},
      "time_span": {
        "start": 0.0,
        "end": 1.0
      },
      "parameter_sweep": {
        "type": "cartesian",
        "dimensions": [
          {
            "parameter": "T",
            "range": {
              "start": 200.0,
              "stop": 320.0,
              "count": 25,
              "scale": "linear"
            }
          }
        ]
      },
      "plots": [
        {
          "id": "H_vs_T",
          "type": "line",
          "description": "Scale height H as a function of temperature T (Eq. 1.4).",
          "x": {
            "variable": "T",
            "label": "Temperature (K)"
          },
          "y": {
            "variable": "H",
            "label": "Scale height H (m)"
          }
        }
      ]
    }
  ]
}