MixingRatio
Volume (mole) mixing ratio of an atmospheric species: xi = c_i / c_total, the ratio of the species molar concentration to the total molar concentration of air. Migrated from AtmosphericDynamics.jl@816cc391 src/seinfeld_pandis_ch1.jl:278 (`MixingRatio` @component). Implements Seinfeld & Pandis (2006) Chapter 1 Equation 1.6. The mixing ratio is dimensionless (stored with unit 1) and in the atmosphere spans roughly twelve orders of magnitude — from ~0.78 for the dominant gas N2 down to parts-per-trillion (~1e-12) trace species — so it is conventionally quoted in ppm, ppb, or ppt. Parameterized as observed-only: c_i and c_total are inputs (parameters in standalone form), xi is the algebraic output. Upstream the Julia @component declares c_i, c_total, and xi as @variables for composition into a parent system; for standalone serialization (3 unknowns vs 1 equation otherwise) c_i and c_total are declared as parameters here, mirroring the IdealGasLaw / ScaleHeight / RelativeHumidity serialization pattern in this directory.
Description
Volume (mole) mixing ratio of an atmospheric species: xi = c_i / c_total, the ratio of the species molar concentration to the total molar concentration of air. Migrated from AtmosphericDynamics.jl@816cc391 src/seinfeld_pandis_ch1.jl:278 (MixingRatio @component). Implements Seinfeld & Pandis (2006) Chapter 1 Equation 1.6. The mixing ratio is dimensionless (stored with unit 1) and in the atmosphere spans roughly twelve orders of magnitude — from ~0.78 for the dominant gas N2 down to parts-per-trillion (~1e-12) trace species — so it is conventionally quoted in ppm, ppb, or ppt. Parameterized as observed-only: c_i and c_total are inputs (parameters in standalone form), xi is the algebraic output. Upstream the Julia @component declares c_i, c_total, and xi as @variables for composition into a parent system; for standalone serialization (3 unknowns vs 1 equation otherwise) c_i and c_total are declared as parameters here, mirroring the IdealGasLaw / ScaleHeight / RelativeHumidity serialization pattern in this directory.
Reference
_source_ref: AtmosphericDynamics.jl@816cc391:src/seinfeld_pandis_ch1.jl:278
Upstream MixingRatio is an MTK @component with c_i(t), c_total(t), and xi(t) as @variables and the single equation xi ~ c_i / c_total (Seinfeld & Pandis Eq. 1.6). For standalone serialization — and to make the component well-posed in isolation (3 unknowns against 1 equation otherwise) — c_i and c_total are declared as parameters here, with xi the single algebraic state. This matches the bead’s (S, observed-only) classification in docs/migration-tracker.md and the IdealGasLaw / ScaleHeight / RelativeHumidity serialization pattern in this directory. The upstream 5.5 MixingRatio Compilation test (test/seinfeld_pandis_ch1_test.jl:485) confirms this input/output split: it compiles the component with inputs = [mr_nns.c_i, mr_nns.c_total], leaving xi as the sole computed unknown. The single algebraic equation is unchanged from upstream.
Upstream provides only structural (1.5 MixingRatio Structure) and compilation (5.5 MixingRatio Compilation) tests for this component — no numerical-accuracy test. The inline tests here therefore anchor on textbook reference values: the total molar concentrations 40.9 mol/m^3 (T = 298 K, p = 101325 Pa) and 44.6 mol/m^3 (STP, T = 273.15 K) given in the chapter’s TotalMolarConcentration discussion, and the standard dry-air mole fractions (N2 0.7808, O2 0.2095, Ar 0.0093, CO2 ~4e-4). Each test’s c_i is c_i = X * c_total for the named mole fraction X, so xi reproduces X.
Tolerance rationale (model-level rel=1e-6): observed-only single-equation algebraic system (no ODE integration); 1e-6 covers float64 roundoff in the single c_i / c_total divide across the full atmospheric mixing-ratio range — xi from 1 (a pure species, c_i = c_total) down to ~1e-12 (parts-per-trillion trace species)._
Parameters
| Name | Units | Default | Description |
|---|---|---|---|
c_i | mol/m^3 | 0.01636 | Molar concentration of species i. Default 0.01636 mol/m^3 — a CO2-like trace species at a ~400 ppm mixing ratio in air at 298 K, 1 atm (c_i = 4e-4 * c_total). |
c_total | mol/m^3 | 40.9 | Total molar concentration of air. Default 40.9 mol/m^3 — the value at T = 298 K, p = 101325 Pa from the ideal-gas law c_total = p / (R * T) (Seinfeld & Pandis Ch 1; 44.6 mol/m^3 at STP). |
Observed
| Name | Units | Default | Description |
|---|---|---|---|
xi | 1 | Volume (mole) mixing ratio of species i, dimensionless — the fraction c_i / c_total. Conventionally quoted in ppm, ppb, or ppt. |
Observed expressions
$$ xi = \frac{c_{i}}{c_{total}} $$Volume (mole) mixing ratio of species i, dimensionless — the fraction c_i / c_total. Conventionally quoted in ppm, ppb, or ppt.
Analyses
xi_vs_species_concentration
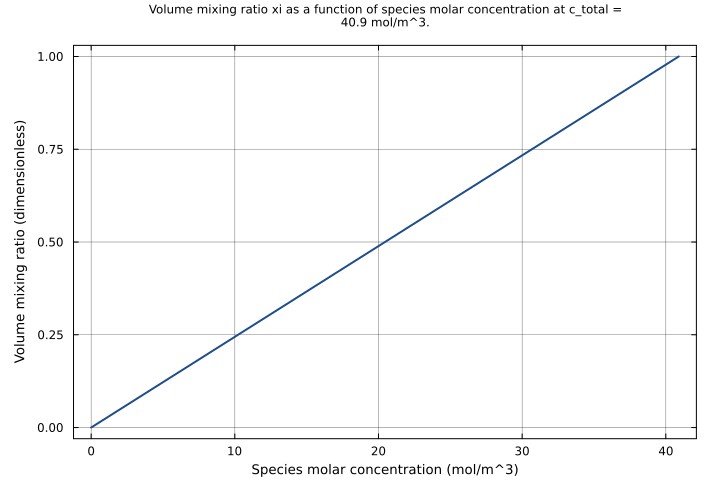
Volume mixing ratio as a function of the species molar concentration at a fixed total molar concentration (c_total = 40.9 mol/m^3, air at 298 K, 1 atm). Reproduces the linear definition xi = c_i / c_total of Eq. 1.6: c_i is swept from 0 to c_total, so xi covers its full physical range 0 to 1.
Time span: 0.0 → 1.0
Swept over: c_i
xi_vs_total_concentration
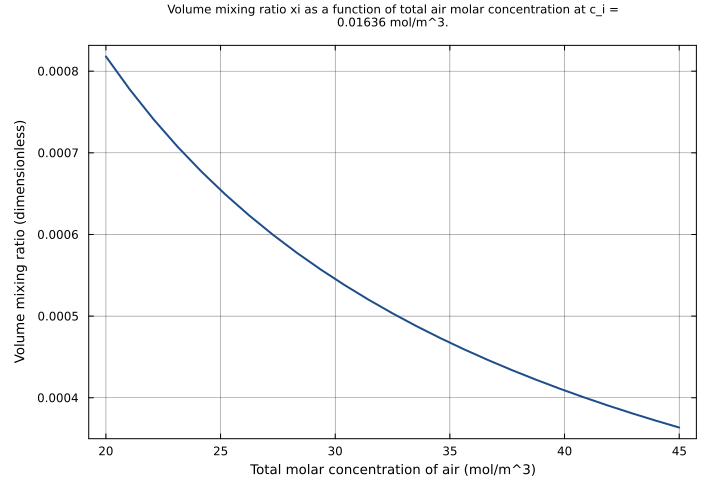
Volume mixing ratio as a function of the total molar concentration of air at a fixed species concentration (c_i = 0.01636 mol/m^3, a CO2-like trace amount). Reproduces the inverse xi proportional-to 1/c_total dependence: at fixed species content, denser air (larger c_total) dilutes the species to a smaller mixing ratio. c_total is swept from 20 mol/m^3 (mid-troposphere) to 45 mol/m^3 (cold, dense surface air).
Time span: 0.0 → 1.0
Swept over: c_total
xi_concentration_heatmap
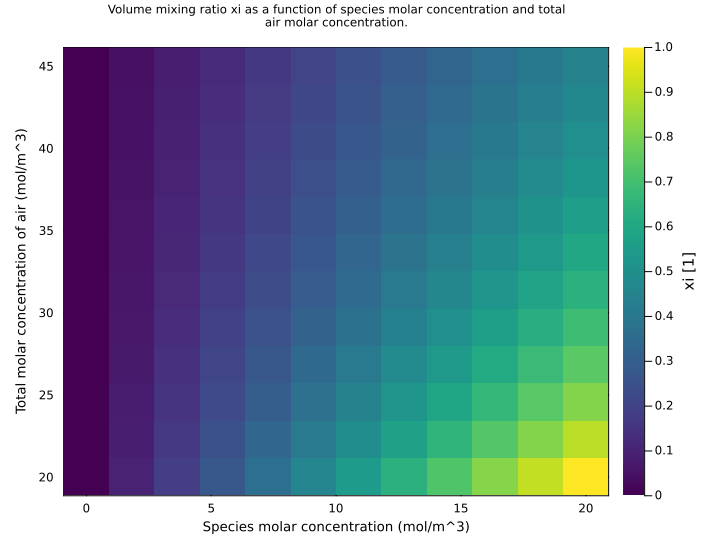
Two-dimensional sweep over species concentration and total air concentration. Surfaces the full xi = c_i / c_total response: the mixing ratio rises with c_i and falls with c_total. c_i is swept from 0 to 20 mol/m^3 and c_total from 20 to 45 mol/m^3, so c_i <= c_total throughout and xi stays within its physical range 0 to 1.
Time span: 0.0 → 1.0
Swept over: c_i, c_total
Raw .esm
Raw .esm JSON (this component)
{
  "reference": {
    "notes": "source_ref: AtmosphericDynamics.jl@816cc391:src/seinfeld_pandis_ch1.jl:278\nUpstream `MixingRatio` is an MTK `@component` with c_i(t), c_total(t), and xi(t) as `@variables` and the single equation xi ~ c_i / c_total (Seinfeld & Pandis Eq. 1.6). For standalone serialization — and to make the component well-posed in isolation (3 unknowns against 1 equation otherwise) — c_i and c_total are declared as parameters here, with xi the single algebraic state. This matches the bead's `(S, observed-only)` classification in docs/migration-tracker.md and the IdealGasLaw / ScaleHeight / RelativeHumidity serialization pattern in this directory. The upstream `5.5 MixingRatio Compilation` test (test/seinfeld_pandis_ch1_test.jl:485) confirms this input/output split: it compiles the component with `inputs = [mr_nns.c_i, mr_nns.c_total]`, leaving xi as the sole computed unknown. The single algebraic equation is unchanged from upstream.\n\nUpstream provides only structural (`1.5 MixingRatio Structure`) and compilation (`5.5 MixingRatio Compilation`) tests for this component — no numerical-accuracy test. The inline `tests` here therefore anchor on textbook reference values: the total molar concentrations 40.9 mol/m^3 (T = 298 K, p = 101325 Pa) and 44.6 mol/m^3 (STP, T = 273.15 K) given in the chapter's TotalMolarConcentration discussion, and the standard dry-air mole fractions (N2 0.7808, O2 0.2095, Ar 0.0093, CO2 ~4e-4). Each test's c_i is c_i = X * c_total for the named mole fraction X, so xi reproduces X.\n\nTolerance rationale (model-level rel=1e-6): observed-only single-equation algebraic system (no ODE integration); 1e-6 covers float64 roundoff in the single c_i / c_total divide across the full atmospheric mixing-ratio range — xi from 1 (a pure species, c_i = c_total) down to ~1e-12 (parts-per-trillion trace species)."
  },
  "tolerance": {
    "rel": 1e-06
  },
  "variables": {
    "c_i": {
      "type": "parameter",
      "units": "mol/m^3",
      "default": 0.01636,
      "description": "Molar concentration of species i. Default 0.01636 mol/m^3 — a CO2-like trace species at a ~400 ppm mixing ratio in air at 298 K, 1 atm (c_i = 4e-4 * c_total)."
    },
    "c_total": {
      "type": "parameter",
      "units": "mol/m^3",
      "default": 40.9,
      "description": "Total molar concentration of air. Default 40.9 mol/m^3 — the value at T = 298 K, p = 101325 Pa from the ideal-gas law c_total = p / (R * T) (Seinfeld & Pandis Ch 1; 44.6 mol/m^3 at STP)."
    },
    "xi": {
      "type": "unknown",
      "units": "1",
      "description": "Volume (mole) mixing ratio of species i, dimensionless — the fraction c_i / c_total. Conventionally quoted in ppm, ppb, or ppt."
    }
  },
  "equations": [
    {
      "_comment": "Eq. 1.6 - Volume mixing ratio definition: xi = c_i / c_total",
      "lhs": "xi",
      "rhs": {
        "op": "/",
        "args": [
          "c_i",
          "c_total"
        ]
      }
    }
  ],
  "tests": [
    {
      "id": "co2_400ppm_default",
      "description": "Canonical default-parameter run: a CO2-like trace species at a ~400 ppm mixing ratio in air at 298 K, 1 atm (c_i = 0.01636 mol/m^3 = 4e-4 * c_total, c_total = 40.9 mol/m^3). Verifies the defining ratio xi = c_i / c_total of Eq. 1.6. The system is algebraic (xi depends only on the input parameters), so xi is also asserted at t = 1.0 to confirm time-invariance.",
      "parameter_overrides": {
        "c_i": 0.01636,
        "c_total": 40.9
      },
      "time_span": {
        "start": 0.0,
        "end": 1.0
      },
      "assertions": [
        {
          "variable": "xi",
          "time": 0.0,
          "expected": 0.0004
        },
        {
          "variable": "xi",
          "time": 1.0,
          "expected": 0.0004
        }
      ]
    },
    {
      "id": "nitrogen_dominant",
      "description": "Dominant atmospheric gas: molecular nitrogen at its standard dry-air mole fraction 0.7808 (c_i = 31.93472 mol/m^3 = 0.7808 * c_total, c_total = 40.9 mol/m^3). Exercises the high end of the mixing-ratio range — N2 makes up roughly four-fifths of dry air.",
      "parameter_overrides": {
        "c_i": 31.93472,
        "c_total": 40.9
      },
      "time_span": {
        "start": 0.0,
        "end": 1.0
      },
      "assertions": [
        {
          "variable": "xi",
          "time": 0.0,
          "expected": 0.7808
        }
      ]
    },
    {
      "id": "oxygen_major",
      "description": "Second most abundant gas: molecular oxygen at its standard dry-air mole fraction 0.2095 (c_i = 8.56855 mol/m^3 = 0.2095 * c_total, c_total = 40.9 mol/m^3). With nitrogen_dominant this confirms the two major air components; the expected value carries the float64 round-off of the divide.",
      "parameter_overrides": {
        "c_i": 8.56855,
        "c_total": 40.9
      },
      "time_span": {
        "start": 0.0,
        "end": 1.0
      },
      "assertions": [
        {
          "variable": "xi",
          "time": 0.0,
          "expected": 0.20950000000000002
        }
      ]
    },
    {
      "id": "argon_minor",
      "description": "Argon, the third most abundant atmospheric gas, at its standard dry-air mole fraction 0.0093 (c_i = 0.38037 mol/m^3 = 0.0093 * c_total, c_total = 40.9 mol/m^3). A sub-percent minor constituent — bridges the major gases and the trace species.",
      "parameter_overrides": {
        "c_i": 0.38037,
        "c_total": 40.9
      },
      "time_span": {
        "start": 0.0,
        "end": 1.0
      },
      "assertions": [
        {
          "variable": "xi",
          "time": 0.0,
          "expected": 0.0093
        }
      ]
    },
    {
      "id": "ozone_trace_ppb",
      "description": "Trace pollutant regime: ozone at a boundary-layer mole fraction of 50 ppb (c_i = 2.045e-6 mol/m^3 = 5e-8 * c_total, c_total = 40.9 mol/m^3). Exercises the parts-per-billion end of the range, where mixing ratios are conventionally quoted in ppb.",
      "parameter_overrides": {
        "c_i": 2.045e-06,
        "c_total": 40.9
      },
      "time_span": {
        "start": 0.0,
        "end": 1.0
      },
      "assertions": [
        {
          "variable": "xi",
          "time": 0.0,
          "expected": 5e-08
        }
      ]
    },
    {
      "id": "stp_total_concentration",
      "description": "Different total-concentration regime: a 1% mixing ratio evaluated at the STP total molar concentration c_total = 44.6 mol/m^3 (T = 273.15 K, p = 101325 Pa) rather than the 298 K value 40.9 mol/m^3. c_i = 0.446 mol/m^3 = 0.01 * c_total. Confirms xi is set by the ratio, independent of the absolute concentration scale.",
      "parameter_overrides": {
        "c_i": 0.446,
        "c_total": 44.6
      },
      "time_span": {
        "start": 0.0,
        "end": 1.0
      },
      "assertions": [
        {
          "variable": "xi",
          "time": 0.0,
          "expected": 0.01
        }
      ]
    },
    {
      "id": "pure_species",
      "description": "Upper-boundary case: the species fills the entire air sample (c_i = c_total = 40.9 mol/m^3), giving the maximum physical mixing ratio xi = 1. xi is algebraic, so the value is also asserted at t = 1.0 to confirm time-invariance.",
      "parameter_overrides": {
        "c_i": 40.9,
        "c_total": 40.9
      },
      "time_span": {
        "start": 0.0,
        "end": 1.0
      },
      "assertions": [
        {
          "variable": "xi",
          "time": 0.0,
          "expected": 1.0
        },
        {
          "variable": "xi",
          "time": 1.0,
          "expected": 1.0
        }
      ]
    },
    {
      "id": "ultratrace_ppt",
      "description": "Extreme low end: an ultra-trace species at a parts-per-trillion mole fraction ~1e-12 (c_i = 4.09e-11 mol/m^3 = 1e-12 * c_total, c_total = 40.9 mol/m^3). Exercises the bottom of the ~12-order-of-magnitude atmospheric mixing-ratio span; the expected value carries the float64 round-off of the divide.",
      "parameter_overrides": {
        "c_i": 4.09e-11,
        "c_total": 40.9
      },
      "time_span": {
        "start": 0.0,
        "end": 1.0
      },
      "assertions": [
        {
          "variable": "xi",
          "time": 0.0,
          "expected": 1.0000000000000002e-12
        }
      ]
    }
  ],
  "analyses": [
    {
      "id": "xi_vs_species_concentration",
      "description": "Volume mixing ratio as a function of the species molar concentration at a fixed total molar concentration (c_total = 40.9 mol/m^3, air at 298 K, 1 atm). Reproduces the linear definition xi = c_i / c_total of Eq. 1.6: c_i is swept from 0 to c_total, so xi covers its full physical range 0 to 1.",
      "initial_state": {},
      "parameters": {
        "c_total": 40.9
      },
      "time_span": {
        "start": 0.0,
        "end": 1.0
      },
      "parameter_sweep": {
        "type": "cartesian",
        "dimensions": [
          {
            "parameter": "c_i",
            "range": {
              "start": 0.0,
              "stop": 40.9,
              "count": 25,
              "scale": "linear"
            }
          }
        ]
      },
      "plots": [
        {
          "id": "xi_vs_ci",
          "type": "line",
          "description": "Volume mixing ratio xi as a function of species molar concentration at c_total = 40.9 mol/m^3.",
          "x": {
            "variable": "c_i",
            "label": "Species molar concentration (mol/m^3)"
          },
          "y": {
            "variable": "xi",
            "label": "Volume mixing ratio (dimensionless)"
          }
        }
      ]
    },
    {
      "id": "xi_vs_total_concentration",
      "description": "Volume mixing ratio as a function of the total molar concentration of air at a fixed species concentration (c_i = 0.01636 mol/m^3, a CO2-like trace amount). Reproduces the inverse xi proportional-to 1/c_total dependence: at fixed species content, denser air (larger c_total) dilutes the species to a smaller mixing ratio. c_total is swept from 20 mol/m^3 (mid-troposphere) to 45 mol/m^3 (cold, dense surface air).",
      "initial_state": {},
      "parameters": {
        "c_i": 0.01636
      },
      "time_span": {
        "start": 0.0,
        "end": 1.0
      },
      "parameter_sweep": {
        "type": "cartesian",
        "dimensions": [
          {
            "parameter": "c_total",
            "range": {
              "start": 20.0,
              "stop": 45.0,
              "count": 25,
              "scale": "linear"
            }
          }
        ]
      },
      "plots": [
        {
          "id": "xi_vs_ctotal",
          "type": "line",
          "description": "Volume mixing ratio xi as a function of total air molar concentration at c_i = 0.01636 mol/m^3.",
          "x": {
            "variable": "c_total",
            "label": "Total molar concentration of air (mol/m^3)"
          },
          "y": {
            "variable": "xi",
            "label": "Volume mixing ratio (dimensionless)"
          }
        }
      ]
    },
    {
      "id": "xi_concentration_heatmap",
      "description": "Two-dimensional sweep over species concentration and total air concentration. Surfaces the full xi = c_i / c_total response: the mixing ratio rises with c_i and falls with c_total. c_i is swept from 0 to 20 mol/m^3 and c_total from 20 to 45 mol/m^3, so c_i <= c_total throughout and xi stays within its physical range 0 to 1.",
      "initial_state": {},
      "parameters": {},
      "time_span": {
        "start": 0.0,
        "end": 1.0
      },
      "parameter_sweep": {
        "type": "cartesian",
        "dimensions": [
          {
            "parameter": "c_i",
            "range": {
              "start": 0.0,
              "stop": 20.0,
              "count": 12,
              "scale": "linear"
            }
          },
          {
            "parameter": "c_total",
            "range": {
              "start": 20.0,
              "stop": 45.0,
              "count": 12,
              "scale": "linear"
            }
          }
        ]
      },
      "plots": [
        {
          "id": "xi_heatmap",
          "type": "heatmap",
          "description": "Volume mixing ratio xi as a function of species molar concentration and total air molar concentration.",
          "x": {
            "variable": "c_i",
            "label": "Species molar concentration (mol/m^3)"
          },
          "y": {
            "variable": "c_total",
            "label": "Total molar concentration of air (mol/m^3)"
          },
          "value": {
            "variable": "xi",
            "reduce": "final"
          }
        }
      ]
    }
  ]
}