BarometricFormula
Barometric formula for an isothermal atmosphere: p(z) = p_0 * exp(-z/H). Gives the pressure at altitude z from the sea-level pressure p_0 and the atmospheric scale height H. Migrated from AtmosphericDynamics.jl@816cc391 src/seinfeld_pandis_ch1.jl:201 (`BarometricFormula` @component). Implements Seinfeld & Pandis Ch 1 Eq. 1.5 — the integrated form of the hydrostatic equation for an isothermal atmosphere. Parameterized as observed-only: z, H, and p_0 are inputs (parameters in standalone form), pressure_ratio and p are the algebraic outputs.
Description
Barometric formula for an isothermal atmosphere: p(z) = p_0 * exp(-z/H). Gives the pressure at altitude z from the sea-level pressure p_0 and the atmospheric scale height H. Migrated from AtmosphericDynamics.jl@816cc391 src/seinfeld_pandis_ch1.jl:201 (BarometricFormula @component). Implements Seinfeld & Pandis Ch 1 Eq. 1.5 — the integrated form of the hydrostatic equation for an isothermal atmosphere. Parameterized as observed-only: z, H, and p_0 are inputs (parameters in standalone form), pressure_ratio and p are the algebraic outputs.
Reference
_source_ref: AtmosphericDynamics.jl@816cc391:src/seinfeld_pandis_ch1.jl:201
Upstream BarometricFormula is an MTK @component with p_0 as a @constant, z as a @parameter, and H, p, pressure_ratio as @variables. The upstream docstring documents H as an input (the scale height is supplied externally). For standalone serialization (and to make the component well-posed in isolation), H and p_0 are declared as parameters here alongside z — matching the (S, observed-only) classification in docs/migration-tracker.md and the sibling sp_ch1 migrations (ideal_gas.esm, scale_height.esm). The two algebraic equations pressure_ratio = exp(-z/H) and p = p_0*pressure_ratio are unchanged from upstream. Constant value p_0 = 101325.0 Pa comes from the upstream module’s P_0 (Seinfeld & Pandis Appendix A).
Tolerance rationale (model-level rel=1e-6): observed-only algebraic system (no ODE integration); 1e-6 covers float64 roundoff in the exp(-z/H) and p_0*pressure_ratio expression chain across the altitude range (0-20 km) and scale-height range (7.4-8.4 km)._
Parameters
| Name | Units | Default | Description |
|---|---|---|---|
z | m | 0.0 | Altitude above sea level (sea-level datum z = 0) |
H | m | 8000.0 | Atmospheric scale height (supplied as an input; typical tropospheric value ~8 km) |
p_0 | Pa | 101325.0 | Standard sea-level pressure (Seinfeld & Pandis Appendix A) |
Observed
| Name | Units | Default | Description |
|---|---|---|---|
pressure_ratio | 1 | Pressure ratio p/p_0 (dimensionless) | |
p | Pa | Pressure at altitude z |
Observed expressions
$$ pressure_{ratio} = e^{-\frac{z}{H}} $$Pressure ratio p/p_0 (dimensionless)
$$ p = p_{0} \cdot pressure_{ratio} $$Pressure at altitude z
Analyses
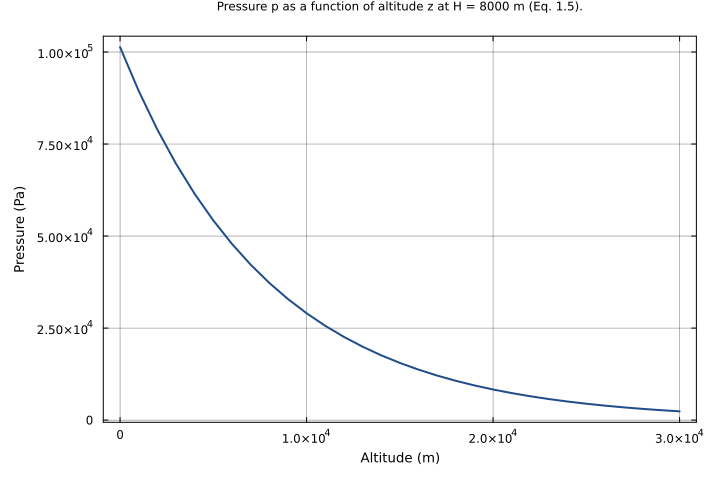
pressure_vs_altitude
Atmospheric pressure as a function of altitude for an isothermal atmosphere with H = 8000 m and standard sea-level pressure. Reproduces the canonical exponential pressure-altitude curve of Seinfeld & Pandis Eq. 1.5 from the surface to 30 km.
Time span: 0.0 → 1.0
Swept over: z
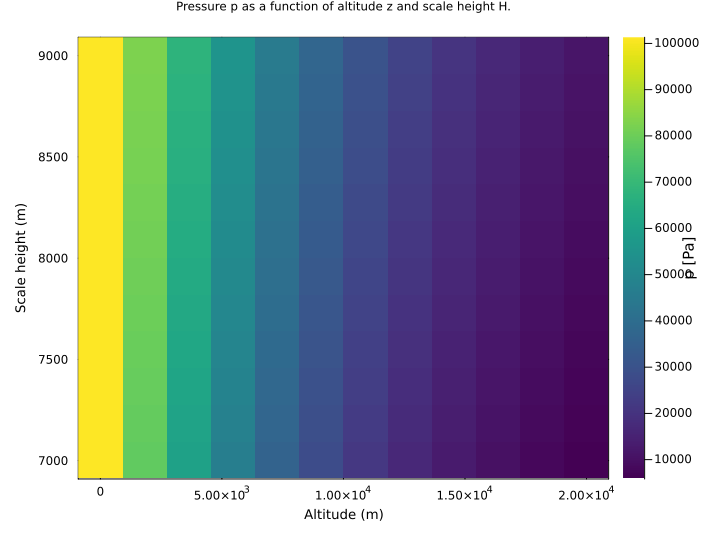
pressure_over_altitude_and_scale_height
Two-dimensional sweep over altitude z (surface to 20 km) and scale height H (cold to warm atmosphere, 7-9 km). Surfaces the joint dependence of pressure on altitude and on the scale height that sets the decay rate.
Time span: 0.0 → 1.0
Swept over: z, H
Raw .esm
Raw .esm JSON (this component)
{
  "reference": {
    "notes": "source_ref: AtmosphericDynamics.jl@816cc391:src/seinfeld_pandis_ch1.jl:201\nUpstream `BarometricFormula` is an MTK `@component` with p_0 as a `@constant`, z as a `@parameter`, and H, p, pressure_ratio as `@variables`. The upstream docstring documents H as an input (the scale height is supplied externally). For standalone serialization (and to make the component well-posed in isolation), H and p_0 are declared as parameters here alongside z — matching the (S, observed-only) classification in docs/migration-tracker.md and the sibling sp_ch1 migrations (ideal_gas.esm, scale_height.esm). The two algebraic equations pressure_ratio = exp(-z/H) and p = p_0*pressure_ratio are unchanged from upstream. Constant value p_0 = 101325.0 Pa comes from the upstream module's `P_0` (Seinfeld & Pandis Appendix A).\n\nTolerance rationale (model-level rel=1e-6): observed-only algebraic system (no ODE integration); 1e-6 covers float64 roundoff in the exp(-z/H) and p_0*pressure_ratio expression chain across the altitude range (0-20 km) and scale-height range (7.4-8.4 km)."
  },
  "tolerance": {
    "rel": 1e-06
  },
  "variables": {
    "z": {
      "type": "parameter",
      "units": "m",
      "default": 0.0,
      "description": "Altitude above sea level (sea-level datum z = 0)"
    },
    "H": {
      "type": "parameter",
      "units": "m",
      "default": 8000.0,
      "description": "Atmospheric scale height (supplied as an input; typical tropospheric value ~8 km)"
    },
    "p_0": {
      "type": "parameter",
      "units": "Pa",
      "default": 101325.0,
      "description": "Standard sea-level pressure (Seinfeld & Pandis Appendix A)"
    },
    "pressure_ratio": {
      "type": "unknown",
      "units": "1",
      "description": "Pressure ratio p/p_0 (dimensionless)"
    },
    "p": {
      "type": "unknown",
      "units": "Pa",
      "description": "Pressure at altitude z"
    }
  },
  "equations": [
    {
      "lhs": "pressure_ratio",
      "rhs": {
        "op": "exp",
        "args": [
          {
            "op": "-",
            "args": [
              {
                "op": "/",
                "args": [
                  "z",
                  "H"
                ]
              }
            ]
          }
        ]
      }
    },
    {
      "lhs": "p",
      "rhs": {
        "op": "*",
        "args": [
          "p_0",
          "pressure_ratio"
        ]
      }
    }
  ],
  "tests": [
    {
      "id": "sea_level",
      "description": "Sea-level datum (z = 0). The barometric formula reduces to pressure_ratio = 1 and p = p_0; this is the boundary condition the formula is anchored to.",
      "parameter_overrides": {
        "z": 0.0,
        "H": 8000.0
      },
      "time_span": {
        "start": 0.0,
        "end": 1.0
      },
      "assertions": [
        {
          "variable": "pressure_ratio",
          "time": 0.0,
          "expected": 1.0
        },
        {
          "variable": "p",
          "time": 0.0,
          "expected": 101325.0
        }
      ]
    },
    {
      "id": "one_scale_height",
      "description": "At z = H the pressure falls by exactly a factor e: pressure_ratio = exp(-1) ~ 0.3679, p = p_0/e. This is the defining property of the scale height (Seinfeld & Pandis Eq. 1.5).",
      "parameter_overrides": {
        "z": 8000.0,
        "H": 8000.0
      },
      "time_span": {
        "start": 0.0,
        "end": 1.0
      },
      "assertions": [
        {
          "variable": "pressure_ratio",
          "time": 0.0,
          "expected": 0.36787944117144233
        },
        {
          "variable": "p",
          "time": 0.0,
          "expected": 37275.38437669639
        }
      ]
    },
    {
      "id": "troposphere_10km",
      "description": "Pressure at 10 km altitude with H = 8000 m. Seinfeld & Pandis Table 1.4 lists ~265 mbar near this altitude; the isothermal-H estimate p ~ 290 mbar is within the textbook's stated 2% tolerance.",
      "parameter_overrides": {
        "z": 10000.0,
        "H": 8000.0
      },
      "time_span": {
        "start": 0.0,
        "end": 1.0
      },
      "assertions": [
        {
          "variable": "pressure_ratio",
          "time": 0.0,
          "expected": 0.2865047968601901
        },
        {
          "variable": "p",
          "time": 0.0,
          "expected": 29030.098541858762
        }
      ]
    },
    {
      "id": "stratosphere_20km",
      "description": "Deep-decay case at 20 km altitude (z = 2.5 H): pressure_ratio = exp(-2.5) ~ 0.082. Exercises the small-pressure tail of the exponential.",
      "parameter_overrides": {
        "z": 20000.0,
        "H": 8000.0
      },
      "time_span": {
        "start": 0.0,
        "end": 1.0
      },
      "assertions": [
        {
          "variable": "pressure_ratio",
          "time": 0.0,
          "expected": 0.0820849986238988
        },
        {
          "variable": "p",
          "time": 0.0,
          "expected": 8317.262485566545
        }
      ]
    },
    {
      "id": "larger_scale_height",
      "description": "Scale-height dependence: at fixed z = 8000 m, a larger H = 8400 m (warm-atmosphere value from scale_height.esm) gives a slower decay than one_scale_height. Verifies the H input is wired into the exponent.",
      "parameter_overrides": {
        "z": 8000.0,
        "H": 8400.0
      },
      "time_span": {
        "start": 0.0,
        "end": 1.0
      },
      "assertions": [
        {
          "variable": "pressure_ratio",
          "time": 0.0,
          "expected": 0.38582130682912413
        },
        {
          "variable": "p",
          "time": 0.0,
          "expected": 39093.343914461
        }
      ]
    },
    {
      "id": "cold_scale_height",
      "description": "Scale-height dependence: at fixed z = 8000 m, a smaller H = 7400 m (cold mid-troposphere value from scale_height.esm) gives a faster decay than one_scale_height.",
      "parameter_overrides": {
        "z": 8000.0,
        "H": 7400.0
      },
      "time_span": {
        "start": 0.0,
        "end": 1.0
      },
      "assertions": [
        {
          "variable": "p",
          "time": 0.0,
          "expected": 34372.3372591107
        }
      ]
    },
    {
      "id": "nonstandard_p0",
      "description": "Non-default sea-level pressure (p_0 = 100000 Pa) at z = 5000 m, H = 8000 m. Verifies p scales linearly with p_0 while pressure_ratio stays independent of p_0.",
      "parameter_overrides": {
        "z": 5000.0,
        "H": 8000.0,
        "p_0": 100000.0
      },
      "time_span": {
        "start": 0.0,
        "end": 1.0
      },
      "assertions": [
        {
          "variable": "pressure_ratio",
          "time": 0.0,
          "expected": 0.5352614285189903
        },
        {
          "variable": "p",
          "time": 0.0,
          "expected": 53526.14285189903
        }
      ]
    }
  ],
  "analyses": [
    {
      "id": "pressure_vs_altitude",
      "description": "Atmospheric pressure as a function of altitude for an isothermal atmosphere with H = 8000 m and standard sea-level pressure. Reproduces the canonical exponential pressure-altitude curve of Seinfeld & Pandis Eq. 1.5 from the surface to 30 km.",
      "initial_state": {},
      "parameters": {
        "H": 8000.0
      },
      "time_span": {
        "start": 0.0,
        "end": 1.0
      },
      "parameter_sweep": {
        "type": "cartesian",
        "dimensions": [
          {
            "parameter": "z",
            "range": {
              "start": 0.0,
              "stop": 30000.0,
              "count": 31,
              "scale": "linear"
            }
          }
        ]
      },
      "plots": [
        {
          "id": "p_vs_z",
          "type": "line",
          "description": "Pressure p as a function of altitude z at H = 8000 m (Eq. 1.5).",
          "x": {
            "variable": "z",
            "label": "Altitude (m)"
          },
          "y": {
            "variable": "p",
            "label": "Pressure (Pa)"
          }
        }
      ]
    },
    {
      "id": "pressure_over_altitude_and_scale_height",
      "description": "Two-dimensional sweep over altitude z (surface to 20 km) and scale height H (cold to warm atmosphere, 7-9 km). Surfaces the joint dependence of pressure on altitude and on the scale height that sets the decay rate.",
      "initial_state": {},
      "parameters": {},
      "time_span": {
        "start": 0.0,
        "end": 1.0
      },
      "parameter_sweep": {
        "type": "cartesian",
        "dimensions": [
          {
            "parameter": "z",
            "range": {
              "start": 0.0,
              "stop": 20000.0,
              "count": 12,
              "scale": "linear"
            }
          },
          {
            "parameter": "H",
            "range": {
              "start": 7000.0,
              "stop": 9000.0,
              "count": 12,
              "scale": "linear"
            }
          }
        ]
      },
      "plots": [
        {
          "id": "p_heatmap",
          "type": "heatmap",
          "description": "Pressure p as a function of altitude z and scale height H.",
          "x": {
            "variable": "z",
            "label": "Altitude (m)"
          },
          "y": {
            "variable": "H",
            "label": "Scale height (m)"
          },
          "value": {
            "variable": "p",
            "reduce": "final"
          }
        }
      ]
    }
  ]
}